 Embryo series courtesy of Einhard Schierenberg
Table of Contents
Behavior reflects nervous system activity and is dependent on multiple factors including external stimuli, past experience, neuronal structure and changes in the internal milieu of the animal. Alterations at the cellular or functional level can profoundly alter basal and evoked activity. Therefore, behavioral assays offer the researcher simple, sensitive and powerful tools to interrogate neuronal function. The sensitivity of behavioral assays can also be their greatest weakness; the behavior of animals can be dramatically affected by small changes or variations in culture or assay conditions. In this short introduction, basic considerations for behavioral assays are very briefly examined. Both general considerations and admonitions relevant to C. elegans behavioral assays are included. Specific protocols for behavioral assays contributed by individual researchers follow this more general introduction.
New behavioral assays are constantly under development and old assays are often revised. Your suggestions, comments and new assays are welcome as this chapter and the appended protocols will be updated on a regular basis.
In the following section various parameters that contribute to behavioral response are described. Not every variable will affect every behavior. But, when troubleshooting or designing an assay, these variables should at least be considered.
Controls: Clearly, controls are absolutely essential for all behavioral experiments. Because responses can vary from day to day it is important for control assays with appropriate strains or animals to be run every day in parallel with experimental animals. Both negative and positive controls should be tested daily. One way is to alternate control and experimental trials to control for extraneous variables. For example, a wild type C. elegans strain (N2) and a defective strain (glr-1) should be tested for nose touch response in addition to any experimental strains under evaluation each day. These daily controls are reported in the literature as control results along with the corresponding experimental results.
The results of an experiment can be subtly or dramatically changed by the expectations or bias of the researcher observing the behavior. Experimenter bias is usually subconscious and exists despite the best intentions of researchers; determined vigilance as to appropriate controls is required. Clearly, this entails considerable effort in both experimental design and daily effort. Ideally, all strains or animals will be scored in the behavioral assay by an observer ignorant as to the genotype, treatment and/or expected outcome. Animals or strains should be renamed and assigned code numbers prior to the experiment by another researcher to avoid bias in scoring. In some cases, only a subset of the animals is scored under these most rigorous conditions. These results of these behavioral assays are subjected to statistical analysis independent of animals tested under less rigorous conditions. If the results from the two groups are statistically equivalent, then all of the data can be pooled for reporting in the literature at the discretion of the authors and with the concordance of the reviewers. Note that these two groups of data may need to be reported independently in “Supplementary Information” for each assay.
Control strains should be raised in parallel under identical conditions this can go beyond just raising animals on the same batch of NGM plates with the same bacteria in the same box in the same incubator. Consider the controls required for behavioral assessment of animals after laser surgery. “Mock ablated” animals of the same genotype and larval stage should also be anesthetized on azide pads for the same time interval as “ablated” animals. Both “mock ablated” and “ablated” animals should be coded before behavioral testing as individual animals, not as groups of animals. This coding avoids experimenter bias toward a specific group of animals. Additional control animals (i.e. negative and positive controls) are also evaluated in parallel with the coded ablated animals to confirm that assay conditions are appropriate. The animals should also be examined to confirm that the laser microsurgery was successful prior to “decoding” the results.
Selecting the correct control animals is crucial. In the evaluation of transgenic strains, the correct control is usually not the N2 wild type strain nor is it “non-transgenic” animals from the same plate. A more appropriate control is the scoring of several independent transgenic strains generated in parallel using 1) the same transgenic marker such as GFP or phenotypic rescue, 2) the same genetic background, 3) an “empty” version of the promoter used to drive the transgene of interest and 4) that are generated by microinjection by the same experimenter. This helps decrease the corresponding problems of genetic background, marker effects on behavior, promoter copy number, and relative gene dosage. “Non-transgenic” animals from the same plate are rarely used as controls because of the mosaic nature of animals carrying extrachromosomal arrays. Unless a cell-specific marker is used to mark a specific cell of interest, “non-transgenic” animals that do not express the transgenic marker may still maintain the array and express the transgene under analysis in other behaviorally relevant cells. Strains in different labs can suffer from genetic drift resulting in altered behavior. If a transgenic strain or mutant strain is obtained from another laboratory, it is a good idea to obtain the corresponding background strain from the same laboratory.
Behavioral assessments should be made by more than one observer, should be repeated several times, and should occur on more than one day. Using more than one observer helps to avoid subconscious bias. Repeating the behavioral assay multiple times and on more than one day ensures reproducibility and consistency. Alternatively, videotaping or other optical recording of behavioral experiments permits multiple researchers to score the behavior.
Cultivation: C. elegans are generally raised on OP50 bacterial lawns on NGM agar plates. Altering the size of the lawn, the type of bacteria, the agar, and the chemicals in the NGM can affect behavioral response. Unless carefully sealed, agar plates and their bacterial lawns lose water to the atmosphere over time. Very dry culture plates should be avoided. Contamination on the culture plates can also dramatically affect behavior. Animals from contaminated plates should not be used for behavioral assays; the short cut of letting contaminated animals feed on uncontaminated plates prior to the behavioral assay is not recommended. As a general rule, mold is less deleterious than yeast or bacterial contamination, but both should be avoided depending on the assay in question. A simple bleaching protocol is sufficient to generate uncontaminated animals whose offspring can be used for behavioral assays.
Crowding and feeding status: The crowding and feeding status of animals can dramatically or subtly affect behavior. For example, animals from crowded plates perform poorly in many avoidance assays. Animals clearly behave differently depending on their feeding status and history. Animals that have been starved during development or animals that have not gone through the dauer stage can have altered behavior compared to animals that have never been crowded. Feeding status also alters behavior. Animals on the bacterial lawn respond differently in behavioral assays compared to animals off the lawn. Along the same lines, increasing time off food alters behavior.
Ambient conditions: The conditions under which assays occur can also affect the results of behavioral assays. Possible environmental factors that can be controlled include room humidity, temperature, drafts, and vibration. The dryness of assay plates can shift response. Some behavioral assays are more sensitive to this than others. Osmolarity and spontaneous reversal rate assays are quite sensitive to plate dryness. Depending on the assay, this can be controlled by pouring plates fresh daily, weighing plates poured at equal volume, or running controls on the same plates.
Ambient conditions (time of day, temperature and humidity) should always be recorded, so their effect can be considered when evaluating data or troubleshooting.
Some behavioral assays are run with plate lids on; some with lids off.
The number of animals used in population assays can affect the outcome; this should also be standardized. For example, introducing too many animals into the circular osmotic barrier used in the classical osmotic avoidance assays can result in crowding and the escape of normally defective animals.
Chemicals: The results of behavioral assays can be dramatically different depending on reagent freshness, purity and supplier. Some chemicals must be made up fresh or diluted on the day of the assay. And, impurities in chemicals (e.g., switching from a 99% pure to a 95% pure chemical) or changing suppliers can alter behavioral results. These caveats apply both to the reagents used for cultivation of the animals and the reagents used in the actual behavioral assays.
Assessing the effect of drugs and other pharmacologically active compounds on behavior involves several more variables. In addition to the preceding admonitions, the stability of the drug, the effect of any solvent, batch-to-batch variation in activity, and the actual concentration of the drug in the assay or assay plate should be considered. Control animals and plates should be treated exactly in parallel. For example, if the drug is dissolved in ethanol and then diluted in water, then the control animals or plates should be treated with the same diluted ethanol solution (lacking the drug). Note that increased osmolarity in the behavioral assay due to inclusion of the drug may alter behavior in some assays.
Stage of life cycle: The sex, age and life cycle stage of the animal tested in an assay is an important factor for behavior. Males are generally used only for assessment of male-specific behaviors. All animals demonstrate lethargic behavior during each molt; staging of young adults is unambiguous so adult hermaphrodites are generally used in assays. The stage of the life cycle can alter behavior in hermaphrodites although many assays can be used on larval animals. Nervous system development is largely complete by the end of the L1 stage, but some developmental changes are clearly coordinated with the L4/adult molt.
Behavioral changes occur during adult stages as well. Some assays are indiscriminate as to the age of the adult, but other behavioral assays are more sensitive. The age of animals can be standardized by “hours after molt to adulthood”, by hours since an egg was laid at a specified temperature, or by the number of eggs in the uterus. The former is preferable in most cases. Animals can also become less responsive to some sensory stimuli after several days of adulthood. Some researchers run behavioral assays only on animals from synchronized plates where adult hermaphrodites laid eggs over a two hour period (and then the parents were removed) to keep animal age constant.
The treatment of animals during the assay can also alter behavior. Most assays require that the animals be treated as gently as possible. Transfer by mouth pipette seems to be the most gentle although this in not recommended as a general lab practice. Gently moving animals with a pick is sufficient for most assays. If an individual animal is damaged in transfer and unable to move properly, then it usually is excluded from the data set. But, the rules for exclusion and the number of animals excluded should be reported.
To avoid ambiguity and inconsistency, it is critical to precisely define the criteria for scoring behavior both in the laboratory and in publications. For example, initiating backward locomotion is generally called a reversal. But, some researchers define a minimum distance the animal has to move backward to score as a bona fide reversal; some do not. Some researchers include omega turns as reversals. And, some researchers count increased backward locomotion as a reversal or response; most do not. A precise definition of the behavior to be scored is critical for analysis.
It is useful to have a “scoring worksheet” to record results for each behavioral assay. In addition to the actual scoring data, the ambient conditions, date, time, genotype, cultivation conditions, researcher name, number of animals scored, and other variables should be recorded.
The number of animals assayed is determined by the assay. As a general rule, 4 large-scale population based assays or 30 individual assays with corresponding controls should be considered a bare minimum. To achieve statistical significance, many more trials may be required.
Data from experimental strains should always be compared to data from control strains analyzed in parallel.
Statistical analysis is critical for drawing conclusions from behavioral data. At a minimum, n and p values should be presented for critical data. Additionally, standard errors of the mean or standard errors should be presented within figures and tables to allow readers to assess significance.
Reproducibility can be difficult for behavioral assays. Control strains may vary in their response from day to day. Statistically, it may be tempting to normalize the data to the control results each day to decrease variation in the reported results. Although this has been done in some cases in the literature, it is clearly more persuasive to present data that has not been normalized. If normalized data is presented, then the non-normalized data should be presented in the corresponding on-line Supplementary Information.
It is wise to confirm the phenotype of strains, sequence plasmids and carefully check other reagents upon arrival. To avoid ambiguity, order crucial strains of C. elegans from the C. elegans Genetics Center (CGC) when possible. When they arrive, freeze multiple copies for long-term storage. Most C. elegans laboratories that specialize in behavior have their own “horror stories” in which genetic drift due to continuous passaging or mislabeling have wasted months of effort. It is a wise idea to thaw an aliquot of any crucial control strains at least once a year (e.g., the wild type N2 strain). Some labs thaw bi-monthly.
Background mutations: In addition to the mutant allele, C. elegans strains often contain other changes in their DNA. Some of these are spontaneous and some are background mutations arise from the original mutagenesis. And, because backcrossing is most effective for unlinked genes, the remaining background mutations may be tightly linked to the mutant allele and gene of interest. Historically, one strategy to confirm that the gene under examination causes the phenotype of interest is to create a trans-heterozygote (examining the behavior of allele A/allele B). If the alleles do not complement in the trans-heterozygous animal, then the mutant phenotypes are likely due to alterations in the function of gene X. Multiple, independently derived alleles of the gene of interest should also be examined if they are available.
Transgenic rescue of a mutant phenotype is the best indication that the behavioral phenotype observed is due to altered function of the gene of interest. For example, cDNA rescue using a heat shock promoter and a transformation marker (described below) may restore normal function to mutant animals. This phenotypic rescue by the cDNA should be confirmed by examining the behavior of transgenic mutant animals that carry the transformation marker and the “empty” heat shock promoter construct. Alternatively, a genomic rescue construct can be used to restore normal behavior, but a mutant version of the genomic rescue construct should not restore behavior.
Integrated transgenic arrays are caused by insertion of exogenous DNA in the chromosome. Therefore the behavioral phenotype of strain carrying an integrated array can arise either from the chromosomal DNA break or from the transgenes on the integrated array. If the behavior of animals carrying the extrachromosomal array is the same as the integrated array, then the behavioral changes are due to the transgene itself.
Transgenic strains: Some markers for generating transgenic C. elegans are preferred for behavioral analysis. GFP or dsRed reporter constructs can be used as transgenesis markers although these usually require the use of a fluorescent dissection microscope for strain maintenance. Historically, transgenic rescue of an unrelated mutant phenotype has been broadly used. Commonly used markers include pha-1, lin-15, dpy-20, or unc-119. Injection of a dominant rol-6 transgene is frequently used for transgenesis C. elegans but the rolling phenotype induced by this transgene interferes with most behavioral assays.
It is important to determine if the transgenic marker used will interfere with the assessment of the behavioral phenotype. GFP or dsRed expression can have deleterious effects. pha-1, lin-15, dpy-20, or unc-119 mutant alleles or even rescued transgenic animals are defective in some behavioral assays.
RNAi knockdown of gene expression is a powerful approach to assess the role of specific genes in neuronal function and behavior. Several approaches can be used with varying efficacy to knockdown gene expression with double stranded RNA in C. elegans. The magnitude of the RNAi knockdown varies dramatically from gene to gene; this is an important consideration in interpreting experiments.
Feeding C. elegans bacteria expressing dsRNA for the gene of interest works in some cases. The nervous system is relatively refractory to RNAi compared to some other tissues, but useful results may still be obtained. Mutant strains with increased sensitivity to RNAi are often used to increase efficacy of gene knockdown; rrf-3 and eri-1 are commonly used. Of course the behavior of control animals raised on control bacterial feeding strains should be examined. For example, as control for a nose touch response RNAi experiment, a bacterial strain expressing the dsRNA corresponding to osm-10 could be fed to rrf-3 and rrf-3; glr-1 animals. osm-10 is expressed in the ASH neurons that are critical for nose touch response, but loss of osm-10 function does not perturb nose touch response. rrf-3 animals raised on osm-10 RNAi bacteria should robustly respond to nose touch; rrf-3; glr-1 animals should not as glr-1 is required for nose touch response.
C. elegans promoters can also be used to express dsRNA in transgenic animals. Usually an inverted repeat of coding sequence from the targeted gene is used for expression of dsRNA, but co-expression of sense and antisense sequences from two separate plasmids can induce RNAi knockdown for some genes. Ubiquitous and inducible gene knockdown can be attempted using common heat shock vector promoters. Cell-specific knockdown is sometimes also possible as dsRNA and RNAi effects spread poorly (if at all) between neurons.
C. elegans behavioral assays encompass a wide range of behaviors and approaches. When combined with current molecular biological, electrophysiological and optical recording techniques, behavioral assays have been remarkably successful in assessing the contribution of genes and specific neurons to behavior. Generous researchers who specialize in each technique have contributed the following protocols. We hope that by providing a resource for the community, that behavioral studies in C. elegans will be made easier, more accessible and clearer for neuroscience researchers in general.
Contributed by Martin Chalfie, Columbia University, New York, NY, USA, March 2005.
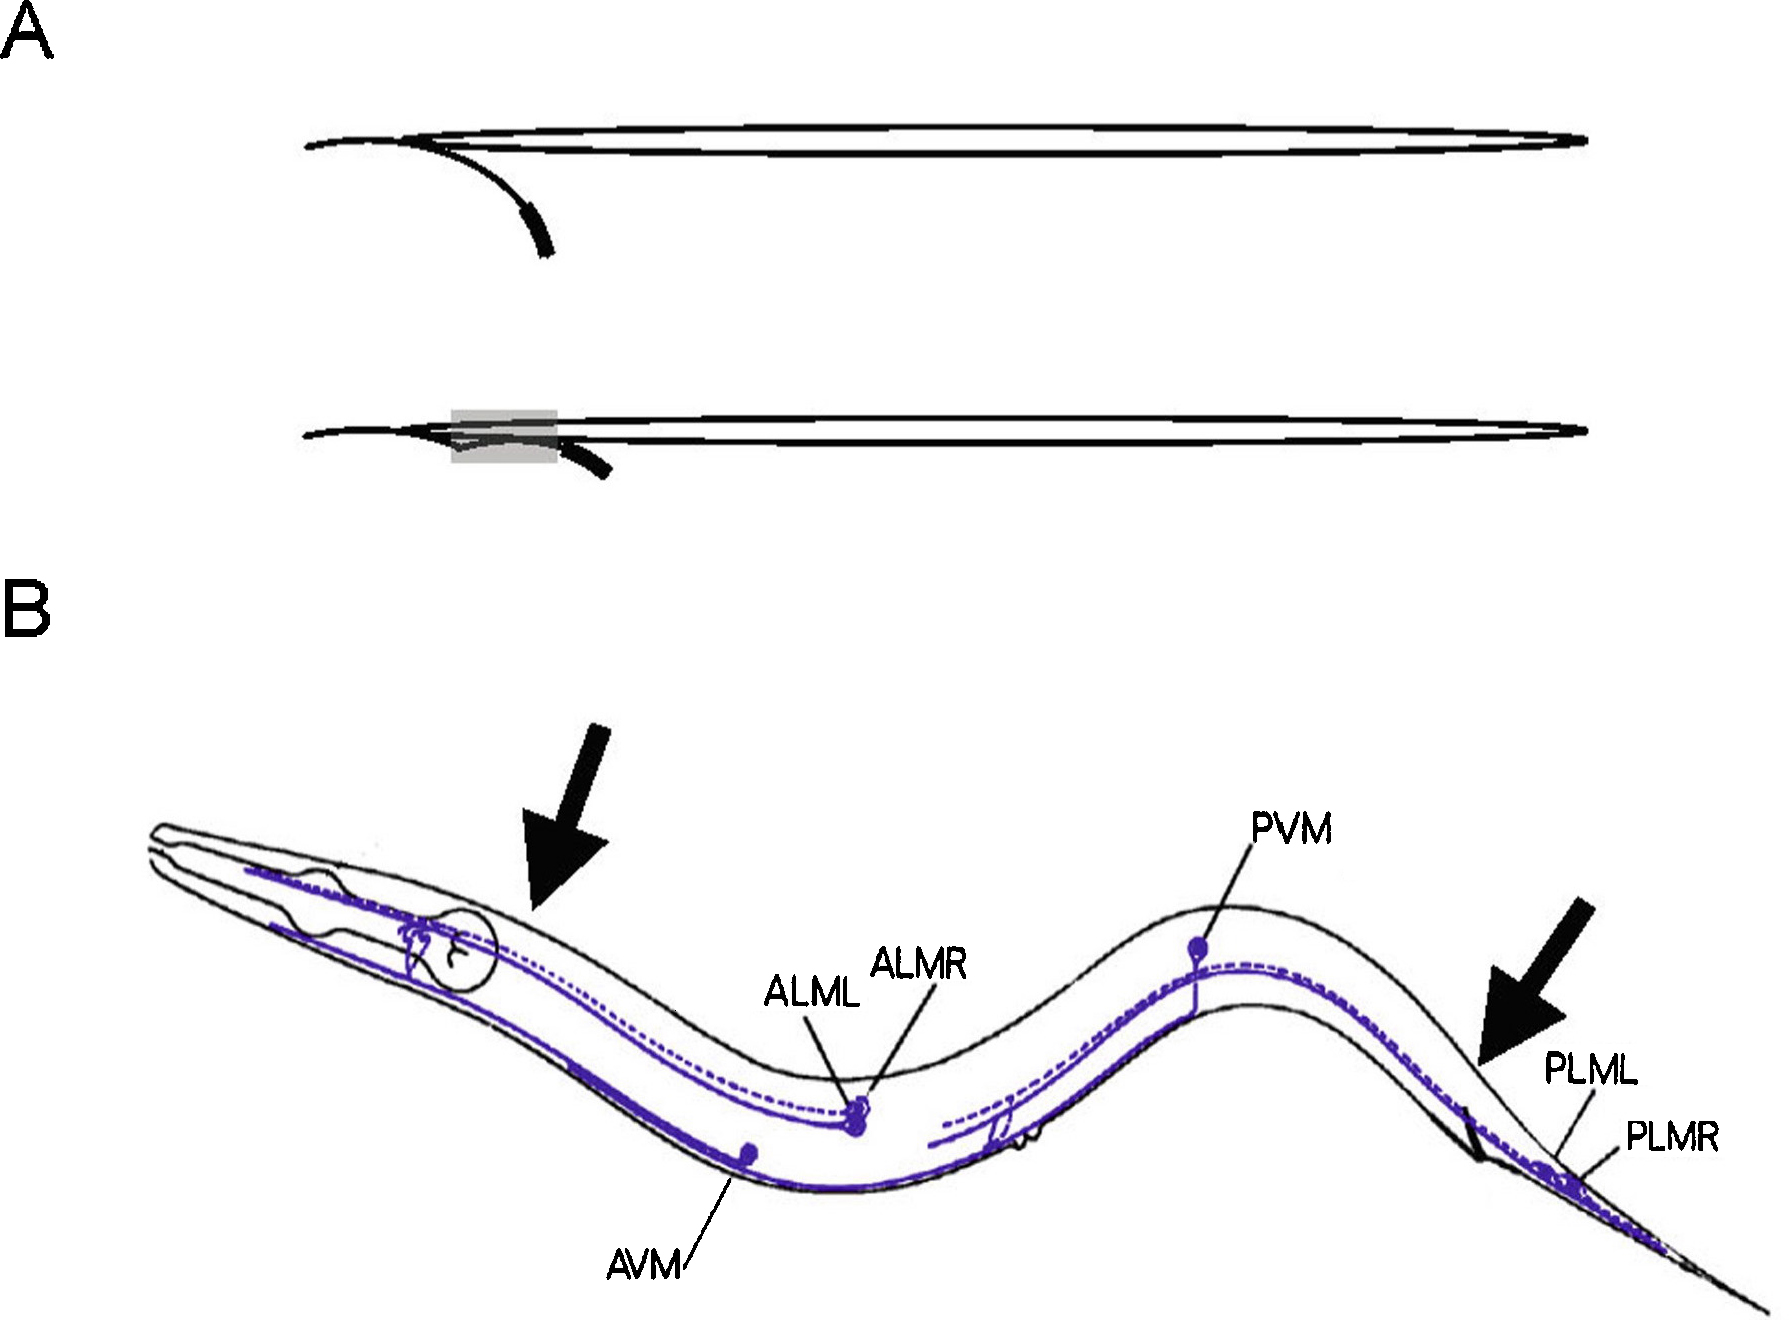
C. elegans senses a variety of mechanical stimuli. These stimuli include gentle touch stimulus delivered to the body (Chalfie and Sulston, 1981; Sulston et al., 1975), harsh touch to the midbody (Way and Chalfie, 1989), harsh touch to the head or tail (Chalfie and Wolinsky, 1990), nose touch (Kaplan and Horvitz, 1993) and texture (Sawin et al., 2000). Gentle touch to the body is sensed by six sensory neurons (ALML/R, PLML/R, AVM, and PVM). An important feature of any assay for gentle touch mediated by these cells is that it not be confused with the response to other mechanical signals. Thus, care should be taken to touch the animals in a way that will not stimulate other mechanosensory neurons. In practice one should avoid too harsh a stimulus and not touch the animals too near the tip of the head or tail.
The initial and most generally used method to test for gentle touch sensitivity is to stroke the animals with an eyebrow hair that has been glued to the end of a toothpick (Chalfie and Sulston, 1981; Figure 1). Eyebrow hairs are used because they are usually not cut and are, thus, finely tapered. They also can be obtained with a minimum of discomfort. Some papers stated that the hairs are from eyelashes. I find, however, that removing eyelashes is a much more painful process. Various glues can be used to secure the hairs, but the hair should be placed so that its shaft extends straight from the end of the toothpick and does not curve away from the tip.
The hair is sterilized by dipping it into a 70% ethanol solution and drying by shaking (don't flame the hair). Sometimes bacteria accumulate on the hair; they can be removed by poking the hair into the agar on a spare plate.
Animals are touched by stroking the hair across the body just behind the pharynx (for the anterior touch response) or just before the anus (for the posterior touch response; see Figure 1). Actually touching the animals in any position along the touch receptor processes will generate a response. Touching the animals near the middle of the body (near the vulva in adult hermaphrodites), however, yields ambiguous results because both the anterior and posterior touch circuits can be activated. The animals should not be poked with the end of the hair, since this provides a stronger stimulus and can sometimes evoke a response, even in touch-insensitive animals. Similarly, animals should not be touched with the end of a platinum worm pick. Animals should not be touched at either the tip of the nose or the tip of the tail as even animals lacking the six touch sensing cells often respond.
The touch assay is really a differential assay, since animals that are dead or paralyzed will also not respond to the stroking. Routinely, animals are said to be touch-sensitive if they respond to stroking with the eyebrow hair by stopping movement toward the hair or move away from the hair (sometimes the touch stops moving animals without having them reverse their direction of movement). Touch-insensitive (Mec) animals fail to respond to the hair, but do respond to prodding with a worm pick. A partial response is one in which the animals move away from only some of the touches.
Touch mediated by the anterior touch cells can be assayed in severely uncoordinated animals by monitoring pharyngeal pumping (Chalfie et al., 1985; M. Chalfie, unpub. data). Touching animals in the anterior slow the rate of pharyngeal pumping. Another output of the touch circuitry is the defecation rhythm, which is reset by stroking the anterior of the animal with the eyebrow hair and is dependent on genes needed for the function of the touch receptor (mec-4, mec-5, and mec-9; Thomas, 1990).
|
Figure 1. Using an eyebrow hair to test gentle touch sensitivity. (A) Positioning (top panel) and gluing (bottom panel) the eyebrow hair to the tooth pick. The thickened black line indicates the shaft of the hair; the gray area indicates the location of the glue. (B) Animals should be touched by stroking the hair across the body at the positions of the arrows. The six touch receptor neurons are indicated.
Wild-type animals will move (adults usually reverse direction) in response to their plate being tapped (Chalfie and Sulston, 1981). This stimulus often happens when plates are placed on the stage of a dissecting microscope. Touch-insensitive animals do not respond to this tapping. Although not as accurate a measure of touch sensitivity as touching with an eyebrow hair, this is a rapid assay that has been used to screen for touch-insensitive mutants (Chalfie and Au, 1989). Plates with F2 progeny of mutagenized parents were dropped from about 1-2 cm above the stage of the microscope and then examined for animals that did not move. Candidate touch mutants were then tested with the eyebrow hair and worm pick to determine if they were touch insensitive. Cathy Rankin and coworkers designed an electric tapper to deliver a taps at defined intervals to plates for their studies examining the touch circuitry and habituation of the touch response (Rankin, 1991; Wicks and Rankin, 1995).
The above assays treat touch sensitivity as an all-or-none phenomenon. Often, however, animals give a partial response to the touch stimulus. In addition, even touch-insensitive animals sometimes respond to the first touch. Two general methods provide a more quantitative measure of the touch response: counting the responses to multiple touches and touching with defined stimuli.
The first instance of using multiple touches with an eyebrow hair to measure the degree of insensitivity to touch was by Hobert et al. (1999). In this assay animals are touched ten times (alternating head and tail touches) and a score is giving for the number of positive responses. At least thirty animals are examined and mean percentage score is obtained. Since individual touches are not always the same, the values obtained in this assay are not truly quantitative. Nonetheless, by using multiple animals relatively subtle difference in touch sensitivity can be revealed (e.g., Hobert et al., 1999; Zhang and Chalfie, 2002). In addition, by separately scoring head and tail responses differences between the two can also be uncovered (Zhang et al., 2004). In using this method one should be careful to distinguish between animals that habituate more rapidly than wild type from those that respond less frequently to the touch stimulus. The animals with the former defect should show a response pattern in which the animals respond less frequently to successive touches; animals with the latter defect should show no pattern to the failures. The experimenter should also determine whether the animals are responding equally (in terms of number of responses) to touches in the head or tail.
von Frey hairs have been used clinically for over a century to test human touch sensitivity. They consist of a series of flexible fibers that are touched end-on to skin and bend once a specific force has been applied. The longer and thinner the fiber, the less force is required to bend it. These calibrated fibers are then used to determine the forces needed to provoke a touch sensation when placed on the skin. We have adapted this method to C. elegans by using fine monofilament nylon sutures (7-0 and smaller; Iris Chin, Miriam Goodman, and M. Chalfie, unpub. data). A short length of suture (Sharpoint, Surgical Specialties, Reading, PA) is attached perpendicularly to the end of a glass capillary (100μL volume) with epoxy and calibrated using an analytical balance. The force (in μNewtons) required for bending is calculated as the weight in (mg) found for the bent fiber X 9.8 m/s2. A limitation of this method is that fibers that deliver less than 10 μN of force are difficult to use because they bend with the air currents normally found in the lab.
Typically, we mount the capillary on a manual micromanipulator with the fiber perpendicular to the agar surface, position a worm underneath the fiber, and make contact by moving the z-axis of the micromanipulator. Animals are touched in the same locations as described above for testing body touch with eyebrow hairs, and the response is noted. Ninety percent of wild-type hermaphrodites respond to a 10 μN of force; virtually all animals respond to forces >100 μN. In contrast, hermaphrodites homozygous for mec-3 and mec-6 null mutations fail to respond to a 100 μN force. Approximately 10% of mec-4 (u253) animals respond to a 100 μN force (the difference may reflect some activity from the PVD cells, which are defective in mec-3 animals).
Extracted from the literature. Comments from researchers who use this assay would be appreciated.
Harsh touch to the body is measured by prodding animals with a platinum wire in the midsection of the body (Chalfie and Sulston, 1981; Way and Chalfie, 1989). Nonmoving gravid adults are prodded at or just posterior to the vulva. Animals respond by initiating locomotion, usually by backing up. Animals to be assayed should be grown in the continuous presence of food. Animals who are starved and animals that have passed through the dauer stage often fail to respond to harsh touch regardless of the functional status of the PVD sensory neurons.
Harsh touch is assessed in animals in which the function of the ALM and PLM neurons have been perturbed as these neurons mediate response to both gentle and harsh touch. Response to harsh touch is mediated by the PVD sensory neurons and perhaps the FLP sensory neurons. The phenotype is called “touch aberrant” (abbreviated Tab) to distinguish it from “Mechanosensory defective” (abbreviated Mec) animals. mec-3, unc-86 and lin-32 animals are Mec and Tab; mec-4, mec-2 and mec-6 animals are nonTab and Mec (respond to harsh, but not gentle touch).
Although the animals are reported to avoid the edge of an agar chunk, little is known about this behavior.
C. elegans dauers can occasionally be found flailing at the top of mold filament independent of plate orientation. (Croll and Matthews, 1977) An overtly similar behavior called nictation is reported to play a role in the dispersal of parasitic nematodes. An assay for this behavior has not been developed.
Contributed by Anne Hart, Massachusetts General Hospital and Harvard Medical School, Boston, MA USA, March 2005.
The nose of C. elegans moves in a rhythmic dorsal/ventral pattern as animals feed on a standard bacterial lawn. (C. elegans lay on their side on agar plates.) This rhythmic nose motion is called foraging in this context. Aberrant foraging rates and patterns of movement can be observed in some strains/animals. The rate of basal foraging is dependent on the RMD motorneurons and on glr-1 function (Hart et al., 1995).
Animals respond to touch to the side of the nose by rapidly moving their nose away from the stimulus; this is called head withdrawal. Response is again mediated by the RMD motorneurons and requires glr-1 function. (Hart et al., 1995) A hair-similar in size to the hair used in the nose touch assay, is placed on the agar plate so that the side of the animal's nose will just barely touch the hair at the maximal extent of the foraging motion. Animals respond by rapidly moving the nose away from the hair. Significant practice is required learn where to lay down the hair and to learn to discriminate between the rapid withdrawal motion versus normal foraging motion. Foraging and head withdrawal assays should be undertaken by observers blind as to genotype or treatment.
Thin bacterial lawns for these assays resemble those used in nose touch assays. They can be prepared by releasing a single drop of an overnight OOP50 culture over a standard NGM plate. Allow the liquid to soak into the plate. To prevent bacterial growth and too much thickening of the bacterial lawn, the plate should be used within a few hours or should be sealed with Parafilm and stored at 4 degrees for weeks. Allow stored plates to return to room temperature before use.
Contributed by Catharine Rankin, University of British Columbia, Vancouver, BC, Canada, March 2005.
The tap-withdrawal protocol measures the responses of a worm to a single tap or a series of successive taps (trains of taps), given to the side of a 4 cm Petri plate filled with 10 ml of NGM agar. The taps/trains cause the worm's environment to vibrate briefly, and this causes the adult worm to swim backwards for some distance (termed a reversal). This technique produces a quantifiable measure of the magnitude of this reversal response. For this assay worms are placed on the center of a Petri plate and are videotaped through the lens of a dissecting microscope. The mechanical tapper is arranged to hit the center of one side of the plate. The tapper is composed of an electromagnetic relay run by a stimulator. (Rankin et al., 1990) The tapper delvers a force of approximately 1 to 2 Newtons per tap which are transmitted through the dish and the agar to stimulate the worm. These experiments are usually run with the lids off of the plates while taps are being delivered. The effects of drugs on the tap response can be assessed by adding the drug plus vehicle to the agar and comparing the results to a group that was tested with just the vehicle for the drug. The length of the reversal to tap can be affected by several variables: 1) The intensity of the tap; Chiba and Rankin (Chiba and Rankin, 1990) showed that the tap response is graded and that stronger stimuli produce larger reversals. 2) The age of the worm; Chiba and Rankin (Chiba and Rankin, 1990), showed that as worms got larger so too did reversals. 3) The agar in the plates; as agar plates age they dry out and lead to differences in the ease with which worms can move. This can be controlled for by only using plates within a certain age range, or by weighing plates prior to use. 4) The reversal response can also be altered by the ambient temperature and humidity in the room where the testing is done. This is probably the result of changes in the agar and ease of movement; it is an important variable to control. At the very least, experimental and control animals must always be run together, on the same day, at about the same time under all of the same conditions. By taking note of temperature and humidity conditions for each animal it will be possible to determine whether variations in either variable affected the outcome of the experiment.
Prior to undertaking tap reflex experiments, it would be advisable to also read the protocols in the Learning, Adaptation and Habituation section on the tap reflex.
Once the experiment has been run and videotaped, then the behavior must be scored. Using stop-frame video analysis, each worm's behavior is scored by tracing its body from the videosimage onto a transparent acetate sheet on the video monitor, going frame by frame through the tape. The adult worm will usually (90% to 95% of the time) respond to the tap with a reversal response, with the size and number of the responses decreasing as stimuli are repeated through the habituation run. In a typical reversal response, a stopped or forward-moving worm moves backwards for a distance (usually less than 1 or 2 worm lengths) and then either remains still or re-initiates forward movement in a new direction. To score the response, a person notes the pre-tap position of the worm, and then traces the total distance the worm reversed (i.e. track length) onto the acetate sheet. Because the head of the worm often makes small side-to12 side foraging movements, reversals are most accurately scored by tracing the path of the tail. In order to have consensus a scoring manual should be developed with rules for scoring variations from this behavior (i.e. the reversal must occur within 1 second of the tap, a pause is scored as 0 backward movement, if the worm is already swimming backwards when the tap is delivered this is a “missing data point” etc). In some cases, a worm will respond with acceleration forward rather than a reversal. In a typical acceleration response, a stopped or forward-moving worm either initiates forward movement or increases its speed, respectively. Generally, in experiments with adult wild-type worms, these acceleration responses are simply scored as missing data points (an adult worm will accelerate to tap only about 5% of the time). Under other circumstances or protocols, such as with larval, mutant or laser-ablated animals, the acceleration response occurs more often and is therefore scored. If a worm accelerates after the tap, the acceleration is scored by measuring the distance the worm moves (i.e. track length) during the 1-sec interval before the tap and subtracting it from the distance the worm moves during the 1-sec interval after the tap. If the measurement for the second after the tap is ≥1.75 X the measurement for the second before the tap then the response is considered an acceleration. It is important to note that the reversal response and the acceleration response are two qualitatively different outcomes, which cannot easily be compared. These “scored” tracings are then scanned into a computer and the length of each is measured using NIH image. The values from this program, representing the reversal/acceleration magnitude, can then be directly transported into a statistical package for data analysis. The frequency of reversals and accelerations is also an important measure of the behavior of the worm, and are scored simply by counting the number of instances of either response.
Contributed by Anne Hart, Massachusetts General Hospital and Harvard Medical School, Boston, MA, USA, March 2005.
C. elegans responds to gentle touch to the nose by initiating backward locomotion. (Kaplan and Horvitz, 1993) This response is the “nose touch response” or Not assay. Response to nose touch is mediated by the ASH, OLQ and FLP sensory neurons. The two polymodal ASH sensory neurons mediated 60% of the wild type response to nose touch. Their ciliated, sensory endings are located at the tip of the nose where they detect light touch to the nose, high osmolarity (Hart et al., 1999) and volatile repellent chemicals (Troemel, 1999).
Nose touch is assayed by laying a hair on the surface of the plate in front of the animal. As an animal moves forward, it contacts the hair with the tip of the nose perpendicular to the direction of movement. Some practice is required to anticipate where the hair must be laid down for an animal to run into at 90 degrees. Normal animals immediately initiate backward locomotion. Defective animals either hurdle over the hair or slide their nose along the hair. An individual animal is tested no more than 10 times in a row to avoid inducing habituation. You can drop the assay plate to induce lethargic animals to move or reverse direction, but you cannot touch the animal to facilitate the assay.
Nose touch can be assayed either on very thin bacterial lawns or off food. Response on food is more robust. Animals that are moved to thin lawns recover within 10 minutes and respond in roughly 90% of trials. Response by animals who have wandered off the bacterial lawn is slightly diminished; animals respond in roughly 80% of trials. Response is dramatically reduced in animals who are physically moved by the investigator to a plate lacking food; animals respond in roughly 30% of trials (Chao et al., 2004).
The hair should be wiped off every few trials to eliminate bacteria and water that may adhere. Normal animals will ignore a wet or slimy hair. A folded “Kimwipe” can be used or clean bare fingers. In the latter case, avoid using lotions, creams or other surfactants. Don't flame the hair. Individual hairs can be reused used for weeks.
The hair used in the Not assay must be of an appropriate size. Too thick will result in all animals responding; too thin will cause even animals of mutant genotype to respond. Hair thickness has definite variation between individuals; arm hair from a female researcher or an eye lash from a male researcher would be a good place to start. The root of the hair is taped to the small end of a glass Pasteur pipette or to a thin wooden stick. Many hospitals stock cotton swabs on thin wooden sticks that are ideal. Slightly thicker hairs are required for nose touch assays on food. Under the microscope it is clear that each hair tapers to a very fine tip. Generally the very end of a hair is too thin and the animal must impact a thicker (and less distal) part of the hair in the nose touch trial.
Thin bacterial lawns for nose touch assays can be prepared by releasing a single drop of an overnight OOP50 culture over a standard NGM plate. Allow the liquid to soak into the plate. To prevent bacterial growth and too much thickening of the bacterial lawn, the plate should be used within a few hours or should be sealed with Parafilm and stored at 4 degrees for weeks. Allow stored plates to return to room temperature before use. If the bacterial lawn is too thick, then the animals may crawl through the food over or under the hair and avoid the nose touch stimulus.
Each hair is tested by comparing the response of N2 and glr-1 animals. (Hart et al., 1995). N2 animals should respond robustly; glr-1 animals should fail in 90% of trials. (Note that eat-4 animals are so defective in their response to nose touch that they are not useful as a control. Lee et al., 1999; Raizen and Avery, 1994) At a bare minimum at least 5 animals should be tested at 10 trials each. Response is expressed as % response.
C. elegans adapt to nose touch after a rapid series of repeated trials. The nose touch trials must be given in fairly rapid succession to adapt the animals' response-without accidentally hitting the animal over the head with the hair. To measure habituation, compare the % response in the first 10 trials to the % response in the trials 40 through 50.
See also: “Chemotaxis and chemoaversion, quadrant assay, version 2” and “Drop assay”.
Contributed by Anne Hart, Massachusetts General Hospital and Harvard Medical School, Boston, MA, USA, March 2005.
Avoidance of high osmolarity (concentrated solutions) by C. elegans was first described by Culotti and Russell (1978). and revisited by various researchers over subsequent years. The original assay, described in an updated format below, tests the rate at which C. elegans will cross an osmotic barrier on the surface of the agar. The barrier is usually circular in shape-referred to as a ring. Animals are placed in the center of the ring (an area of low osmolarity) so they are surrounded by the high osmolarity ring which will they avoid as a noxious stimulus. Animals escape the ring by crossing the high osmolarity barrier. Outside the ring is normal NGM agar, a region of low osmolarity. In practice, the rate at which animals escape is dependent on several parameters. Particularly critical are plate dryness, the number of animals in the ring versus the size of the ring, and the rate of diffusion of the osmotic barrier. The assay is dependent on the number of times that animals encounter the osmotic barrier; special consideration must be taken when assessing osmotic avoidance for uncoordinated or lethargic animals. Hermaphrodites are assayed.
Control strains must be used each day. N2 animals are generally used as positive controls as they robustly avoid the ring barrier. Generally, che-3 or osm-10 animals are used for negative controls. Uncontaminated, uncrowded cultures must be used. Animals that have been starved during their life, those close to running out of food, animals that have passed through dauer or animals from culture plates that are very dry should not be assayed.
The number of animals to be tested determines the size of the ring. A 5/8th inch diameter ring holds 30 to 100 animals for population assays; a 3/8thinch diameter ring holds 1 to 5 animals. Too many animals for a specific ring size leads to aberrantly high escape rates; too large a ring for the number of animals leads to aberrantly low escape rates.
The dryness of the assay plates is a critical consideration and can be the critical variable to control. The objective is to obtain a large number of plates of uniform dryness. Plate dryness is assessed by weighing the plates. Once you establish the correct plate weight in your lab, then (if the plate volume poured remains unchanged) finding good plates for the assay is relatively straight-forward.
NGM agar plates are allowed to sit out on the bench overnight after a large batch is poured. It is important that an equal volume of media is poured into each plate; an automated media dispenser is ideal. The next day the plates are inverted and then placed in a plastic box. The length of time required for plates to dry depends on atmospheric humidity in the laboratory and how the box is covered. In winter in Boston it can take only a few days for plates to dry in a box with a closed (but not tightly sealed) lid. In summer, it can take weeks. To identify plates of uniform dryness, plates are removed from the box and individually weighed. If a constant amount of plate media is dispensed during plate pouring, then the weight of each plate is directly related to how dry the plate is (how much evaporation has taken place). If the amount of media is a constant over weeks or months, then plates can be often selected based on weight alone-once the correct weight is determined in behavioral assays. Be sure to remove any condensation from the plate lid before weighing.
The only definitive test to determine the correct weight (and dryness) is to run the osmotic avoidance assay with the control strains. A good rule of thumb to start with here is that animals crawling on the agar surface of an appropriately dried plate should have a visible, but small meniscus.
Alternative approaches: The drying process can be hastened by covering the box with a large Kimwipe (as opposed to a lid) although uniformity of plate dryness may decrease. Or, plates can be dried in a sterile hood for a few hours to hasten the drying process-but the plates must be allowed to equilibrate with the lids closed for several hours afterward.
Prepare 8M glycerol in water. This corresponds to a 60% solution of pure glycerol in water; “pure glycerol” from Sigma is a 13M solution. Add a tiny bit of bromophenol blue to color the 8M glycerol and the resulting rings blue. 8M glycerol aliquots can be stored in the −20°C freezer for years; aliquots are stable at room temperature for days.
Depending on the number of animals to be assayed, either ultra fine point Sharpie lids (∼3/8th inch) or metal test tube caps (∼5/8th inch) are obtained. C. elegans S Basal is required for population assays.
Osmotic barrier rings must be printed onto the agar of the assay plate so they will be ready as soon as the animals finish rinsing in the S Basal (see next paragraph). Usually four assay plates can be run in one batch. Obtain 4 additional 6cm Petri dish lids and four metal test tube caps. Pipette about 25 to 30μl of 8M glycerol into the surface of each inverted lid. Place the open end of the cap down onto the inverted lid bisecting the drop of glycerol. Spin the cap against the surface of the lid to spread the glycerol around the circumference of the cap. Lift the cap. If there is a bubble of glycerol closing the cap, then pop it. Place the lid with glycerol very gently onto the agar of an assay plate. Try to avoid marring the surface of the agar. Let the glycerol soak into the agar; this usually takes between 2 and 5 minutes. Lift the cap off. Check to make sure the annular osmotic barrier is uniform. Always run the control animals in duplicate (e.g., N2 and osm-10) first to confirm that the assay plates are working. It is a good idea to run control interspersed with experimental animals during the assays.
Rinse animals off culture plates and into a 1.5ml microfuge tube with 1ml of S Basal using a Pasteur pipette. No need to close the tube lids. Let animals settle by gravity for 5 minutes, remove excess S Basal and add another 1ml. After 5 to 10 minutes, move animals in a minimal amount of liquid to the center of the osmotic ring. Remove excess liquid by very gently blotting with a rolled up Kimwipe. Once the excess liquid is removed and animals start crawling, the timing begins for that assay plate. Record the time the assay starts. Replace plate lid and avoid disturbing animals by dropping or tapping the plate during the assay. Repeat till all four assays are underway. When the assays are done, wipe off the caps and lids so they can be reused.
Animals should move actively within the ring during the assay period. N2 animals should avoid entering the osmotic barrier for at least 10 minutes; 50 to 80% of osm-10 or other control animals should either die in the osmotic barrier or cross it and escape the ring. Those who die in the ring are counted as escapers. If too many N2 animals escape, then the plates are likely too wet. If too few osm-10 animals escape, then the plates are likely too dry.
The number of animals that have escaped at 10 minutes is recorded along with the number of animals that remain in the ring. The % escaping animals is calculated. At least 5 assays per strain or genotype are suggested; these should be determined on at least two different days.
The rate at which animals encounter the osmotic barrier is important in determining their response. If limited animals are available-or individual animals need to be tested, then smaller rings should be used.
Rings can be generated using ultra fine point Sharpie lids and 20 μl of 8M glycerol as described above. Use the open end of the Sharpie lid. Animals to be assayed are gently (and rapidly) picked from the bacterial lawn to an empty plate (to eliminate food) to the assay plate. Up to 5 animals can be used in a ring of this size. At least 7 rings with at least 4 animals for each genotype is a good staring point. As described above, control strains should be run before experiments begin.
If the osmotic response of individual animals must be assessed (e.g., laser ablation experiments), then animals should be assayed at least 4 times. Once an animal crosses the osmotic barrier, then the animal is immediately returned to the bacterial lawn for at least 15 minutes.
If small numbers of animals are used, then it is convenient, and perhaps more accurate, to record the time the animals cross the barrier, not the % escaping. While the assay is running, plates are checked every minute and the number of animals who have escaped is recorded. The average time to escape is then calculated.
Contributed by Gert Jansen, Erasmus Medical Center, Rotterdam, The Netherlands, March, 2005.
We discriminate three different responses using the quadrant plate chemotaxis assay for salts as developed by Steven Wicks (Wicks et al., 2000):
Chemo-attraction to 0.1–100 mM NaCl or other salts.
Chemo-aversion of 1 M NaCl.
Gustatory plasticity, i.e. the response of C. elegans to 25 mM NaCl after 15 min pre-exposure to 100 mM NaCl (Jansen et al., 2002).
Briefly, pairs of opposite quadrants of four-quadrant Petri plates (Falcon X plate, Becton Dickinson Labware, USA) are filled with 16 ml buffered agar (2% agar, 5 mM K2HPO4/KH2PO4 MgSO4) either containing a dissolved attractant or no attractant. The plates are left open to solidify and dry for 60 min. Then the plates are closed and stored for use on the same day. Just before the assays are performed, i.e. just before washing off worms, adjacent quadrants of the assay plates are connected with a thin layer of molten agar (without attractant). Assays are always performed in duplicate, try to control for environmental influences by placing the plates on the bench in different orientations. In addition, assays should always be repeated on separate days.
Animals are prepared by bleaching gravid adults and washing the eggs with M9 and growing the animals for approximately 72 hrs at 25°C. During a 15 min wash, the well-fed, young adult nematodes are washed three times with CTX buffer (5 mM KH2PO4/K2HPO4 pH 6, 1 mM CaCl2 and 1 mM MgSO4) and 100–200 worms are placed at the intersection of the four quadrants in 5 ul CTX buffer. Most of the buffer can be removed with a pipette, or a tissue. The distribution of the worms over the four quadrants is determined after 10 min. A chemotaxis index (CI=(A-C)/A+C, where A is the number of worms over quadrants 1 and 3, C is the number of worms over quadrants 2 and 4) was calculated at each time point. As attractants we use 100 microM, 1, 10, and 100 mM NaAc, NaCl, NH4 Ac and NH4Cl. As repellent we use 1 M NaCl.
To test the plasticity of the response of C. elegans to salts, animals are pre-exposed to the compound tested during the washing steps (Jansen et al., 2002). We found that the optimal concentration for pre-exposure was 100 mM NaCl. The 100 mM salt was simply added to the CTX washing buffer. Optimal pre-exposure time was 15 min, longer pre-exposure was toxic, especially for some mutants, while shorter pre-exposure had less effect. Subsequently, the animals are tested in a standard water-soluble compound chemotaxis assay for their attraction to the salt used during pre-exposure. We found that chemotaxis to 25 mM NaCl worked best.
Contributed by Stephen Wicks, Boston College, Chestnut Hill, MA, USA, March, 2005.
This assay was developed to assay attraction from or avoidance of soluble compounds, or to compare concentrations of a single compound (Wicks et al., 2000). The assay is robust enough to characterize known mutants, or to screen for new mutants which fail to approach or avoid soluble compounds such as salts, sugars, amino acids and other potentially biologically significant compounds. This assay is effective (chemotaxis index of 0.99 from some compounds), probably because the gradients that develop between adjacent quadrants are very high, and thus demonstrating a preference for one compound over another, or a discrimination of two concentrations, is an easy task for the worm. The assay relies on the use of segmented plastic Petri plates. A variety of manufacturers sell appropriate plates. Ideally, the plates should have no (or at least only a very small) raised arm - a recent innovation that facilitates robotic handling of plates-restricted to the periphery. A plate will have 4 equally sized quadrants. Each quadrant should have a volume capacity of 10-12 mls. and is filled with agar containing the dissolved compound of interest solublized in molten agar. In practice we generally fill opposite pairs of quadrants with the same compound-containing agar. Thus, each quadrant is adjacent to two quadrants containing the other compound or concentration of interest. Each quadrant is overfilled such that surface tension provided by the sterilized plastic is just sufficient to keep the agar from spilling, and the agar is allowed to dry. It is important to keep the volume in each quadrant the same as in all other quadrants. Once the agar has solidified, the tops of each plastic wall that separates the four quadrants is coated with agar containing no attractant to provide a smooth, continuous surface over which animals move. It is also allowed to dry and cool. A population of animals is then spotted at the intersection of the quadrants in a small (4-10 microliter) volume of low salt buffer. The population will segregate over the quadrants that contain the preferred taste. Animals present in each quadrant are counted at several time points to assess adaptation and changing taste preferences.
Procedure 1. Quadrant plate preparation
Plates are available from Falcon. Cases of 500 plates (Falcon #351009 X PLATE Petri dish with lid) each of which is 100 mm (diameter) by 15 mm (deep) are typically ordered.
Taxis Agar is composed of 2% agar (MOPS buffered). We have found that for most salts, 10% of 0.1 M MOPS (we pH the MOPS to 7.2 with 25% ammonium) is sufficient to control the pH, although this does not appear to be true for amino acids or other free bases. The desired attractants are dissolved in solution prior to autoclaving. After autoclaving, the solutions are brought to 1 mM CaCl2 and 1 mM MgSO4. Don't add TWEEN or any other detergents; these disrupt the surface tension of the agar too much. As an alterative we also have been using phosphate buffered agar.
After the agar cools to about the temperature that you could comfortably hand pour (55-60 degrees C), an autopipetter is used to distribute 12.6 ml of agar (the exact volume will depend on the plate used) into each quadrant of the plate. Typically, I place similar attractants into opposite quadrants of the plate. The surface on which the agar is distributed should be level, as this volume will bring the agar level above the plastic spacers between quadrants; surface tension keeps the agar from spilling from one quadrant into adjacent ones. (Also, don't shake or bump the bench or table!).
Let the agar cool and harden. Then, a few minutes prior to testing a population, draw about 0.5 ml of buffered agar (with CaCl2 and MgSO4) into a glass pipette and gently but briskly fill the “valleys” between adjacent agar-filled quadrants on each plate. I have tried using a lower agar concentration for this step to avoid building any significant “topography” for the worms and that works well also, but, with care this is not necessary.
A population of animals is washed off of plates and rinsed once with a low-salt CTX-buffer solution (1mM CaCl2, 1mM MgSO4, 5mM potassium phosphate, pH=6.6), placed over the centre of the plate in about 10ul of CTX Buffer and allowed to partition over time. The worms will often show a preference almost immediately (within 30 s) even prior to the evaporation of the buffer.
The preference for one kind of moiety (or concentration of moiety) over the other is generally expressed as fraction of worms over that moiety divided by total number of worms per plate (although, obviously it could also be expressed as [# worms over attractant - # worms over control] / Total # worms, as with the odorant assays from the Bargmann lab). This is calculated at various time points (generally, I use 10 min 20 min, 30 min, 45 min, and 60 min-sometimes also 5 min if the buffer has evaporated).
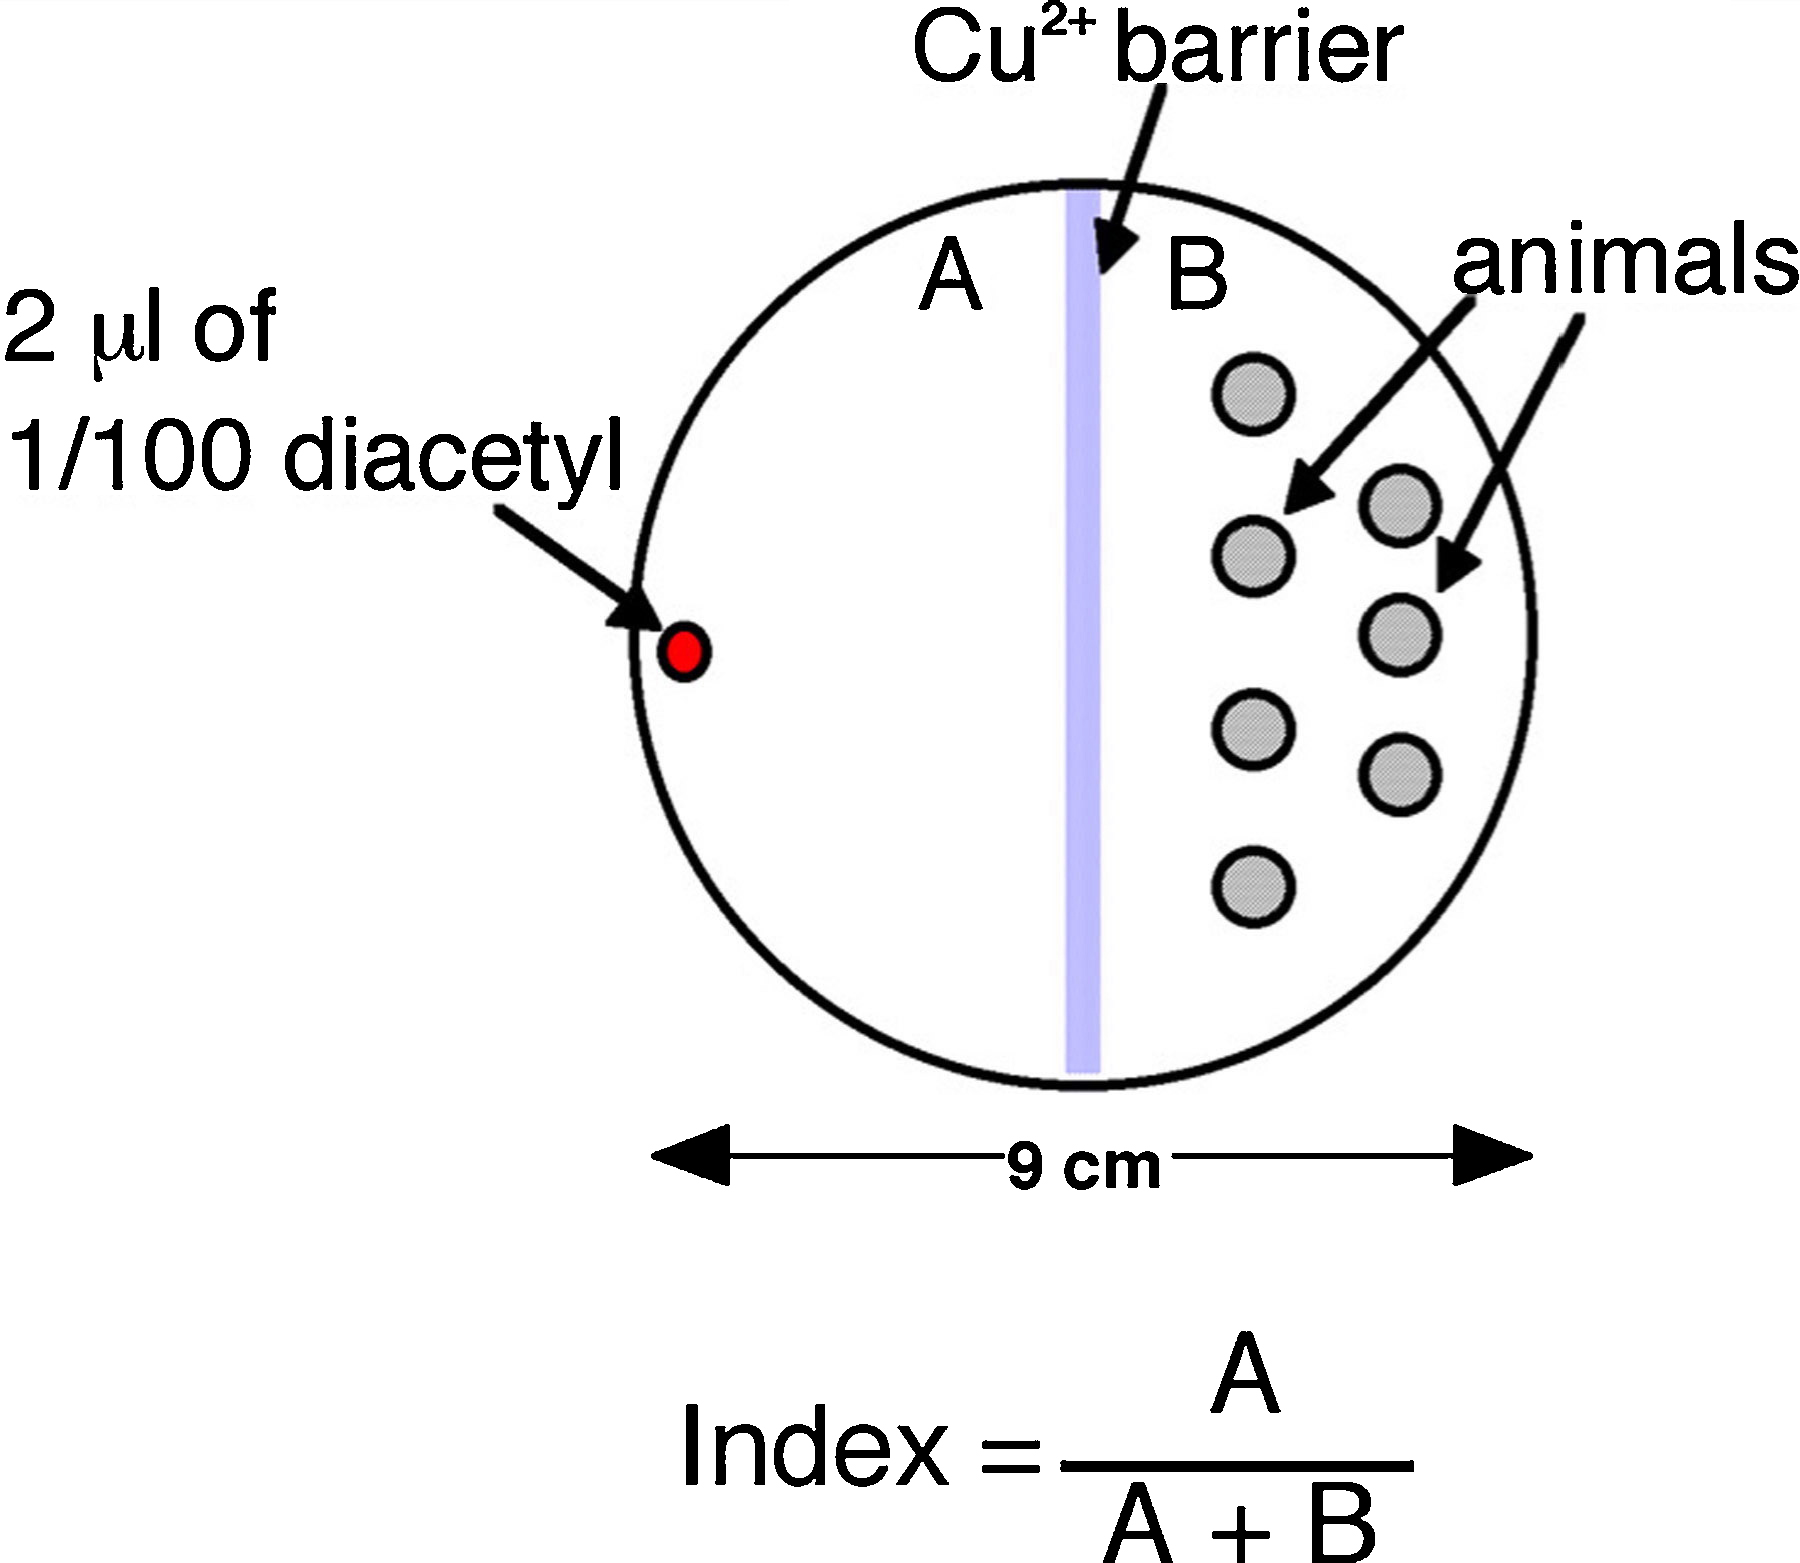
Genetic screens for animals defective for avoidance of aversive compounds were carried out on assay plates with 103-104 worms per plate. The assay plates were prepared by pouring 5 ml of chemotaxis agar (1.5% agar, 75 mM NH4Cl, 10 mM MOPS, pH 7.2 with NH4OH, and 0.25% Tween 20) into a 9 cm Petri dish. A thin line (25 μl) of an aversive compound (e.g., copper as 150 mM CuSO4, 2 % SDS, or high osmotic pressure as 4 M fructose; Ward, 1973) was poured across the midline of the Petri dish and another 25 μl traced in a semicircle around one half of the dish (Figure 2). Young adult worms were washed twice with S-basal buffer to remove bacteria. Immediately after the compound was absorbed into the chemotaxis agar, worms were placed on one side of the assay plate in a small volume of buffer. Excess buffer was carefully removed with tissue paper. A volatile attractant (2 μl of isoamyl alcohol 1:10 dilution in ethanol) was placed across the assay plate 1 cm from the opposite edge with the aversive semicircle. Normal, healthy worms approached the attractant, but stopped abruptly at the boundary formed by the repulsive compound. Individuals that passed through the aversive barrier were isolated and allowed to produce self progeny. To quantify the behavior of a given strain, an aversion index (A.I.) was calculated by dividing the number of worms that, one hour after placing the worms on the plate, crawled through the aversive compound by the total number of worms on the plate (approximately 250–500). This index includes all animals that attempt to crawl up the side of the plate.
Contributed by Paolo Bazzicalupo and Massimo Hilliard, Istituto Internazionale di Genetica e Biofisica, Naples, Italy, March, 2005.
These two assays were developed to study the avoidance response of individual worms to water soluble repellents. They can efficiently be used to score populations as well. Reference to and practical use of these tests can be found in Hilliard et al. (2004) and in Hilliard et al. (2002). These papers also report some controls strains (especially mutants tested) that can help researchers understand and define the usefulness of these assays. Main use of the assays: determine the phenotype of single animals to characterize existing mutants, isolate new mutants, characterize laser-operated animals, study spatial resolution of sensory organ, study water-soluble repellent adaptation. Possible other applications include response to volatile repellent.
In this assay, a small drop of repellent is delivered near the tail of an animal while it moves forward. Once in contact with the tail, the drop surrounds the entire animal by capillary action reaching the anterior sensory organs. If the substance is sensed as repellent the animal stops moving forward and starts moving backward. If the substance is not sensed as a repellent the animal will continue its forward movement.
Animals: Well fed young adult hermaphrodites. With some experience and appropriate controls, younger larvae and males can also be tested. Animals are washed off the plates were they have grown, put on unseeded NGM plates and allowed to rest at room temp for 10-15 minutes before testing. We always challenge the worms to be tested with a few drops of buffer alone (and they should not respond). Occasionally populations of worms appear hyper-reactive. In these cases the test should be postponed to avoid false positives.
Plates: The tests are conducted on unseeded NGM plates. In some cases a more controlled composition of the medium may be desirable (e.g., without Ca and/or Mg ions, lower salt concentration etc.). NGM can certainly be substituted by other media but appropriate controls are necessary. It is possible to use M13 plates (plates in which the agar is dissolved in M13 buffer, see below, in which repellents are usually dissolved) to reduce possible interference due to the change in composition between buffer and medium.
Best results are obtained with fresh, non wet plates such that the tracks of the moving worms can be detected but will disappear in few minutes. Assays are done at room temperature as long as it does not exceed 24-25 °C. Plates should be allowed to equilibrate to the room temp.
Repellents: All repellents are dissolved in: 30 mM Tris-HCl pH 7.0, 100 mM NaCl, 10 mM KCl (M13 buffer). We have used quinine, other alkaloids, Denatonium etc. at 10mM final concentration. Cu++ and Zn++ were also used at 10mM. For Low pH avoidance we used 0.1 or 0.2 M Acetic acid. For osmotic avoidance we used Glycerol at 1M. It is advisable to determine dose response curves if new repellents are tested. With appropriate controls buffer composition, repellent concentration and the composition of the medium can be modified.
Delivery of the stimulus and scoring: Drops are delivered using 10μl glass capillaries (Blaubrand intraMARK or equivalent) pulled by hand on a flame to reduce the diameter of the tip. The capillary is mounted in a holder with rubber tubing and operated by mouth pipetting. In case of toxic compounds, all the mouth operations can be performed using a 1-5 ml syringe. We calculated the average drop size to be about 5 nanoliters. The size of the drop has to be large enough such that the liquid surrounds the animal and can reach the anterior sensory organs but not so large that the animal looses adherence to the substrate and swims in it. The animal usually starts a backward motion within 1 second of the delivery of the drop. The response to each drop is scored as positive if the animal reacts within 4 seconds. The avoidance index (a.i.) is the number of positive responses divided by the total number of trials. The a.i. will range between value of 1 and 0 where higher values indicate stronger repellent response, lower values indicate weak response. As described below the a.i. can be used to define the response of single animals as well as of populations.
In the single animal assay (for example to determine the phenotype and thus the genotype of one animal derived from a cross-or to determine the effect of cell ablation on one animal) repeated drops are delivered to the same animal. The single animal is transferred from the growing plate to the test plate with a platinum wire or an eyelash and allowed to rest and adapt to the new plate for 5-10 minutes before starting the assay. An ISI (Inter Stimuli Interval) of at least two minutes is used between successive drops to the same animal. Each animal is tested with no more than 20 successive drops; the animal is then transferred onto a new seeded plate and allowed to recover for one or two hours before starting a new set of experiments. No more than 3 sets of 20 drops each were conducted per day on each animal. In most cases the phenotype is accurately determined with just 10 drops. The avoidance index (a.i.) will be the number of positive responses divided by the total number of trials.
Two methods can be used to define the responses of populations of worms:
10 to 50 (usually 30) well-fed adult animals of the same population are placed each on a small NGM unseeded agar plate and allowed to rest for 5-10 minutes. Each animal is then tested with several successive drops (5-30) as described in the single animal assay. The results of all animals belonging to the same population are then combined. This is our preferred population method since it provides data on the individual variation within the population and the results are amenable to more accurate statistic analysis.
A population of well-fed adult animals is washed with buffer and placed on a large unseeded plate. The animals are allowed to rest for 15 minutes and then at least two series of 50 animals of the same population are challenged each with a single drop of the chosen substance. Each response is recorded as either positive or negative. The a.i. is the number of positive avoidance responses divided by the total of trials (drops delivered). This is obviously faster than the other method and often it is more than satisfactory.
The dry drop test resembles the drop test except that the animal encounters the repellent substance after the drop has been absorbed into the agar. In this case the drop is delivered about 0.5-1 mm anterior to the animal (head stimulus). This assay allows spatial resolution between anterior and posterior sensory organs since it prevents the capillary action (present in the drop test) that brings the substance and thus the stimulus on the entire body surface. In the drop test both amphid and phasmid neurons are stimulated, in the dry drop test only amphid neurons are stimulated. Thus a difference in response between drop test and dry drop test may indicate a role of the phasmid neurons in determining the response.
It is also possible to separate stimulation of anterior and posterior sensory neurons by confronting the animals with two dry drops. The first just anterior to the animal nose; the second just posterior to the animal tail (0.3-0.5 mm). With this strategy, the animal is forced to encounter the repellent first anteriorly with the head (e.g., amphids) and then, during the backward movement, with the tail (e.g., phasmids). In this case, the duration of the backward response is the measure of the effect of the posterior sensory organ. For instance with SDS as a repellent, the backward response is reduced from an average of 3 seconds if only head stimulus is applied, to 2 seconds if the repellent is applied also on the tail as described in Hilliard et al. (2002).
Other variations: Another interesting use of the dry drop test was done in the Maricq lab (Mellem et al., 2002). In their analysis, instead of simply scoring the response as either negative or positive, they measured the delay of the response from the time when the animal encountered the repellent on the agar to the time when the backward response begins.
The drop test can be used to investigate the adaptation of animals to water soluble repellent substances. Two adaptation paradigms have been used:
Worms are exposed to successive stimuli (drops) and the response to each drop is recorded as either positive or negative. If the ISI (inter-stimulus interval) is short enough (10 to 30 seconds) the avoidance index (determined by testing 10 or more worms) undergoes a decrease on the second stimulus and will undergo further reductions on successive stimuli. The adaptation is reversible and after an adequate period of rest the a.i. will go back to normal. The main parameter that can be varied in the assay is the length of the ISI. If the ISI is long enough no adaptation will be detected.
Worms are exposed to the repellent continuously for a relatively long period of time and then the avoidance response to the repellent is tested by the drop test. The a.i. is calculated by testing 10 to 30 worms. In this test, Cu++ exposure for 1 minute, is able to induce a strong reduction in the response to Cu++, which lasts several minutes but is again reversible. In practice a large drop of the repellent is deposited on the unseeded plate and the animal is kept swimming in it. After the desired time, the animal is moved to a clean section of the plate and after 1 minute, tested with the repellent in the same modality used in the drop test. Because adaptation is revealed by a reduced response it is necessary to distinguish it from general toxic effects. This can be done by testing the avoidance response to some different repellent stimulus (to which adaptation has not occurred). Determination of the recovery time may in same cases also be important.
Contributed by Cori Bargmann, The Rockefeller University, New York, N.Y. USA, March, 2005.
Nematodes are grown on E. coli strain HB101 at 20°C (Brenner, 1974). Raise all animals with plentiful food in uncrowded conditions (ideal-place about 3 adults on one 6 cm plate with food, or 10 adults on one 10 cm plate with food, wait 4 days at 20 and test their progeny; for mutants you will need to place down more adults at the beginning-about twice as many for osm-6 as for N2). Wild-type animals are C. elegans variety Bristol, strain N2. Test animals in their first or second days as adults, larvae do not perform as well.
Chemotaxis assays are based on the assay developed by Ward (1973).
Assay plates are 10 cm tissue culture dishes containing 10 ml of:
| 1.6% BBL-agar (Benton-Dickinson) or 2% Difco-agar. Autoclave, then add: |
| 5 mM potassium phosphate, pH 6.0 |
| 1 mM CaCl2 |
| 1 mM MgSO4 |
For volatile attractants, use plates 12-36 hours after pouring. If plates are contaminated with mold, do not use. To prepare plates for assay, make two small x marks 180 degrees opposite each other on the bottom (plastic) plate near the edges of the plate. Label one with the name of the attractant to be used. Place 1 microliter of 1 M Sodium Azide (POISON) on the agar above each x. Let this soak in as you prepare the worms. (Suzuki et al., 2003; Voisine and Hart, 2004).
Wash the worms off an unstarved plate with 1.5 ml S Basal (Brenner, 1974; we just use phosphate-buffered saline and omit the cholesterol). Place in an Eppendorf tube. Let the worms settle to the bottom (3-5 minutes). Remove the supernatant and wash with S basal 2 additional times, letting worms settle each time, and then once with water. Do not skip any washes, since coli interfere with the assay. Work quickly here-if you let the animals sit around for too long, they get sluggish and do not perform well. The washes enrich for larger animals (adults), which is what you want.
Pipette the worms in a small volume (10 microliters or so) onto the Petri plate, equidistant from the two xs, slightly off center (see origin, Figure 2). Remove excess liquid with a Kimwipe, leaving worms on agar. Pipette 1 microliter of attractant on the agar at the labeled x, 1 microliter of diluent (usually ethanol) at the unlabelled x. Close the lid of the plate and don't open in again if you don't have to.
After 10 minutes or so make sure the worms are not all clumped at the origin. If they are, disperse them with a wire pick.
Count the total number of worms.
At 60 minutes, count the worms anaesthetized at each of the two x marks.
Calculate the chemotaxis index:
| i=(# worms at attractant at 60'-#worms at control at 60')/total number of worms. |
Using a variation of the assay above, response to a given odorant can be affected by saturating amounts of another odorant (Bargmann et al., 1993). This saturation assay was used to group volatile odorants into seven classes. The saturating odorant is mixed into the molten agar prior to assay plate pouring. In the published paper, 1μl of benzaldehyde or diacetyl was added to 10ml of agar.
Odorant exposure can decrease subsequent response. Each odorant saturates response to itself before saturating response to other odorants. The above protocols are used for exposure and measuring response.
Contact Cori Bargmann (The Rockefeller University, New York) for details and see Gray et al. (2004).
Contributed by Cori Bargmann and Amanda Kahn, The Rockefeller University, New York, USA, March, 2005.
C. elegans respond rapidly to exogenous polyunsaturated fatty acids. This response is dependent on TRPV channel function and mediated by sensory neurons (Kahn-Kirby et al., 2004). Animals are tested off food on NGM plates that have aged overnight at room temperature in stacks of four plates. Pick animals off food as young adults to a clean plate, then transfer without food to an assay plate. Let the animal crawl 15 minutes after transfer with the lid off. For a given strain, animals are assayed with 25 drops of 1M glycerol, and ethanol/M13 controls prior to lipid exposure to establish the baseline response. Then, for the experiment on another assay plate do 25 trials each with M13/ethanol, diluted fatty acid #1 and diluted fatty acid #2. All trials should be done with a half hour of transfer. M13 buffer contains 30 mM TRIS pH 7.0, 100 mM NaCl, and 10 mM KCl.
Undiluted fatty acids were obtained from Nu-Chek Prep (Elysian, MN) and stored at -20°C in the dark in sealed glass vials. Glass vials containing fatty acids are readily opened using a glass chromatography column cutter ceramic knife. Fatty acids are aliquoted undiluted using a glass Pasteur pipette into small amber glass Kimble vials obtained from VWR (∼4ml, with small black caps, no plastic lid inserts) for storage. The vials are sealed under nitrogen by blowing a stream of nitrogen over the neck of the vial, Parafilmed, and frozen.
For lipid drop test assays, prepare a fresh 200 mM stock in ethanol fresh each day. Vortex to dissolve. This 200 mM stock PUFA solution in ethanol is diluted into M13 immediately prior to the assay, vortexed for 30 seconds, and flushed with nitrogen. Transfer a small amounts of the diluted fatty acids to microfuge tube for assays; close microfuge tube during assay.
Two lipid solutions were tested during each assay, and the investigator was blind to lipid identity. Positive (N2) and negative (osm-9) control strains were assayed along mutant strains each day, and mutant data was collected only if positive and negative control animals displayed normal performance on M13 and 1M glycerol assays. Fatty acids concentrations tested range between 2mM and 0.01mM (4mM is usually too high). EPA can be used as a canonical fatty acid.
Extracted from the literature, see Simon and Sternberg (2002).
Unless indicated otherwise, all males come from the him-5 (e1490) mutant, which segregates XO male progeny by X chromosome nondisjunction during meiosis (Hodgkin et al., 1079). To construct cue source regions, the muscle mutant unc-52 (e444), individuals of which become relatively motionless by the time they are young adults, was used. For the vulvaless experiment we constructed a let-23 (lsy1) unc-52 (e444); dpy-20 (e1282)lin-3 (n378); him-5 (e1490) strain (PS3980; Aroian and Sternberg, 1991; Ferguson and Horvitz, 1985). lov-1 (sy582δ) and pkd-2 (sy606δ) have been described (Barr et al., 2001). The sensory mutants osm-5 (p813) and osm-6 (p811), as well as the diverse isolates CB4932 (Taunton, England), CB4555 (Pasadena, CA), and CB4856 (Hawaii) were obtained from the Caenorhabditis Genetics Center (St. Paul); isolates are described by Hodgkin and Doniach (Hodgkin and Doniach, 1997) and further characterized by de Bono and Bargmann (de Bono and Bargmann, 1998). Similar to wild-type [Bristol N2; him-5 (+)] strains, males from isolates occur spontaneously at an inconveniently low frequency in the self-progeny of hermaphrodites. To obtain a constant supply of males, isolates were heat shocked and maintained by backcrossing. To test males from osm-6, him-8 (e1489); osm-6 (p811) strains were made, and the presence of osm-6 was verified by use of fructose avoidance and dye-fill assays (http://cobweb.dartmouth.edu/_ambros/worms/16.html; Culotti and Russell, 1978). All animal stocks were stored at 18°C. All stocks and animals harvested for upcoming trials were grown on standard 5-cm diameter NG agar plates inoculated with the Escherichia coli strain OP50, grown in Luria-Bertani media (LB), as a food source.
Bacterial lawns were grown on standard 5-cm diameter agar plates for all trials: three drops of OP50-inoculated LB, spread thinly, with a ∼0.25-centimeter gap between the edge of the lawns and the walls of the plates, to dissuade test animals from leaving trials. Plates were then stored at ∼22°C for 2 days until used for trials. Source and test animals were harvested daily at the fourth larval stage (L4), and stored at ∼18°C overnight with 10-20 animals per same-sex plate to be used the following day in trials as young adults. The muscle mutant unc-52 was used to condition agar plates for at least 3 and up to 8 h (see Figure 1a in Simon and Sternberg, 2002). Five to 10 min before the onset of a particular trial, source animals were removed. Trials consisted of the introduction of a single test animal on to a single trial plate (see Figure 1a in Simon and Sternberg, 2002), and movement of the animal was then documented for 5 min. Effort was made to orient animals in the direction of the 3 × 7-mm scoring regions. A motor-driven stage attached to a computer joystick was used to help videotape trials through a dissecting microscope. Trials were videotaped, and the number of reversals per crossing and the time animals spent in conditioned region were scored and are on record. Backwards movement equal to or greater than a body length was counted as “1 reversal”; backward movement less than a body length was counted as “0.5 reversal.” We used the frequency of reversals as indication that males detect a cue; it seems likely that when males pass over a mate-finding cue that they will move backwards, and by repeated reversals, home in on a cue's source. Equal numbers of unconditioned and conditioned agar trials were run in parallel on ∼5 plates each per day; moreover, trials were run blindly and interspersed at random. Isolate trials were run in parallel alongside trials of the laboratory strain (Bristol N2). Unconditioned agar trials were meant to parallel conditioned agar trials as closely as possible: (i) made from same day bacterial lawns, (ii) kept at the same temperature, and (iii) had bacteria picked on and off to mimic introduction of source animals as on conditioned agar trials. Average temperature during trials was ∼22°C.
The holding assay was identical to the response assay with the following modifications: (i) source animals were introduced in a pile in area A, (ii) test animals were introduced directly on this conditioned spot (see Figure 1b in Simon and Sternberg, 2002); (iii) in addition to area A, number of reversals was scored in outwardly stacked, concentric ring-areas (with radii of 1 mm, 5 mm, 16.5 mm, and ∼25 mm; unequal sized areas were normalized by dividing outer ring-areas by 24, 247, and 330, respectively); and (iv) movements of test animals were documented for 10 min.
Design of the attraction assay was similar to the holding assay with the following modifications: (i) source animals were left to condition a point source for 24 h; (ii) at the onset of each trial, individual hermaphrodites were placed atop conditioned regions; and (iii) test males were introduced ∼1.5 cm from the conditioned point source/unconditioned scoring region (see Figure 1c in Simon and Sternberg, 2002).
Contributed by Ikue Mori, Nagoya University, Nagoya, Japan, March, 2005.
The experimental procedure of interaction assay was reported by Ishihara et al. (2002).
The working bench should be horizontal. Avoid sources of wind or vibration-such as a centrifuge machine or a draft chamber nearby. Do not use an incubator for the assay because it is strong source of wind of fan and vibration from the compressor.
Room temperature should be kept at 25 ± 1 °C.
6-cm seeded NGM plates. Use a 6-cm plate containing 14 ml of NGM, which is minimal volume required for getting sufficient bacterial lawn. The NGM plates were spread with overnight-cultured E. coli, incubated for a day at room temperature (or for overnight at 37°C), and stored at room temperature. Do not use old seeded NGM plates (over 2 weeks).
C. elegans: Use the healthy adult animals from uncrowded plates. Animals should be maintained by transferring 2 to 3 animals to a new NGM plate before starving. Do not use the starved animals or those from a starved agar chunk.
Assay plate: The medium consists of 2% agar, 50mM NaCl, 1mM CaCl2, 1mM MgSO4, and 10mM pH 7.0 HEPES. After autoclaving, pour 10 ml of the medium exactly into a 9-cm plate. Store at 4°C and use within 2 weeks. Spread 25 ml of 100 mM (CH3COO)2Cu solution on the midline of an assay plates, and place at room temperature for 18-22 hr to allow diffusion before the assay.
Wash buffer: 0.02% gelatin, 50mM NaCl, and 25mM pH 6.0 potassium phosphate.
Collect well-fed animals with wash buffer.
Wash animals with wash buffer three times.
Put animals as several drops on one side of the Cu2+barrier on the assay plate (30–90 animals) (See Figure 2).
Leave the plates with lids for 90 min on the working bench.
Put several drops of chloroform on the lid to stop the animal.
Count the number of adult animals on each side of the barrier (Figure 2), and calculate the index. The index is defined as the percentage of animals on the odorant side divided by the total number of animals.
See also “Adaptation” within “Nose touch response” in the Mechanosensation section, “Adaptation using the drop assay” within the “Drop assay” in the Chemosensation section., “Plasticity” within “Chemotaxis, chemoaversion and plasticity, quadrant plate, version 1” in the Chemosensation section., “Distinguishing between odorants during cross-saturation” and “Decreased response after chronic exposure to attractant” within “Chemotaxis to volatile point source” in the Chemosensation section.
Contributed by Catharine Rankin, University of British Columbia, Vancouver, BC Canada, March, 2005.
The following discussions are predicated on the description of the tap reflex in the Mechanosensation section.
A number of decisions need to be made prior to running any experiment on habituation to tap: 1) The age of the worms to be used; Chiba and Rankin (1990) showed that it is only after the end of the larval stages that worms consistently reverse to tap. It is best to use worms of the same age for the experiments because for wild-type worms the length of the reversal response is directly related to the length of the worm. 2) How many stimuli will be delivered; Rankin and Broster (1992) showed that the higher the number of stimuli the longer it took for spontaneous recovery to begin. 3) The interstimulus interval (ISI or frequency) of the taps; over a series of experiments we have shown that habituation at short ISIs has different properties from habituation at long ISIs and is probably mediated by some different mechanisms (reviewed in Rose and Rankin (2001)). 4) Whether there will be food (E. coli) on the plate or not; for short-term habituation experiments there is not usually food on the plate; for long-term habituation experiments that last 24 hours there usually is a small amount of food. And 5) at the end of the experiment will there be tests for either spontaneous recovery or for dishabituation? Whatever decisions you make, the most important thing is to be consistent. In addition it is important to always run control animals at the same time and under exactly the same conditions as the experimental animals. That means run one experimental and then one control throughout the experiment. If you are testing mutant strains the best control is the N2 strain from the lab where the mutant was made or into which it was backcrossed. Alternatively a rescue strain might be a good control-however the high level of variability in some rescue strains makes this sometimes problematic.
When worms that have been habituated to tap are left unstimulated for a period of time they show spontaneous recovery of the tap response. To look at spontaneous recovery worms are left on the microscope stage and are given test stimuli at various intervals after habituation training to determine the extent to which the response has recovered. Spontaneous recovery can be used to distinguish habituation from sensory adaptation or motor fatigue. Worms habituated at short ISIs show great habituation, but recover more rapidly (within ∼10 min) than worms habituated at long ISIs (at least 30 min), which show less overall habituation. This rapid recovery following habituation at short ISIs is the opposite of what would be predicted for adaptation or fatigue (where the most decremented group should recover the most slowly).
Dishabituation can also be used to distinguish habituation from sensory adaptation or motor fatigue. In dishabituation the habituated response is rapidly recovered by the delivery of a dishabituating stimulus that is usually a strong novel or noxious stimulus. In this protocol, the dishabituating stimulus is a brief train of electric shocks, generated by the Grass S88 stimulator. The shocks are delivered using a hand-held spanning electrode (a bipolar electrode used for stimulating rat brains) with wires placed into the agar on either side of the worm, about 3 to 4 worm widths apart. The 2 forks of the electrode thus span the animal, piercing the agar about 1 worm width away on each side of the cuticle, at about the middle of the worm's length. Neither fork of the electrode actually contacts the cuticle--the shock is transmitted solely through the agar. The train of shocks usually consists of 10 ms shocks of 60 V at 10 PPS for 600 ms. It is important to decide on the appropriated delivery time for the shock-the worms require about 30 seconds to recover from the shock, and so it is important to give them time to recover before the first tap. However, if there is a long interval between the last tap of habituation and the first tap following shock it is important to control for any spontaneous recovery that might have occurred in the interval by having a control group in which the same interval is given, but no shock delivered. Following this dishabituating stimulus an additional set of 10 taps at the same ISI as training, is given to assess the effect of the shock on the response that was habituated. Dishabituation is shown by the increase in response amplitude above habituated levels following the shock.
To assess long-term memory for habituation tap stimuli are delivered in a distributed or spaced training procedure. For training approximately 20 young adult worms are pre-plated on an agar plate containing a thin lawn of E. coli 24 hours prior to training. A second plate for control worms is pre-plated at the same time. Both plates are left on a vibration-free shelf in the lab over night. Twenty-four hours after pre-plating the experimental plate is placed on the stage of the dissecting scope and taps are delivered. The worms receive four blocks of 20 taps each. With in a block taps are delivered at a 60 s ISI, and between blocks there is a 1-hour rest period (Rose et al., 2002). The control plate of worms receives a single tap at the end of the training period. One hour after the end of training worms from the experimental and control plates are transferred to individual Petri plates (again with a thin lawn of E. coli) and left on the vibration free shelf for approximately 22 hours. To test for long-term memory for habituation each worm (both experimental and control) is given a set of 10 taps at a 60 s ISI. Testing can begin about 22 hours after training and continue until 26 hours after training. Responses to the test taps are scored and long-term memory is considered to be present when the mean response magnitude of the trained or experimental worms is significantly smaller than the mean response magnitude of the control worms. In these experiments it is usual to have at least 20 worms per group. It is possible to test drug effects on memory by delivering the drug through the agar that the worm is on during training (for drug experiments worms can be pre-plated on drug containing plates 1 hour prior to training). For drug experiments there are four groups of worms tested: drug trained and control groups, and vehicle trained and control groups. Worms are removed from the drug plates 1 hour after training is completed and tested approximately 24 hours later on plates without drug. The drug is considered to have blocked memory if the vehicle group shows normal long-term memory with trained worms having smaller responses to the 10 test taps than control worms, and if the drug group shows no difference between trained and control worms. In addition, to show that the drug did not damage the worms in some way it is important that the control worms for the drug and vehicle groups do not differ from one another.
Contributed by Jill Bettinger (Bettinger and McIntire, 2004) as a modification of Cori Bargmann's original adaptation protocol (Colbert and Bargmann, 1995), March, 2005.
Adaptation plates are prepared as follows:
10 mLs of adaptation agar (3% agar, 5mM KPO4 [pH6], 1 mM CaCl2, 1 mM MgSO4) or chemotaxis assay agar (2% agar, 5mM KPO4 [pH6], 1 mM CaCl2, 1 mM MgSO4) is aliquoted into 10 cm Petri plates, and allowed to dry overnight. The day of the experiment, all plates are dried at 37°C without lids for 1 hour, and a representative plate of each type is melted to determine volume. Ethanol is added to appropriate plates to a concentration of 200 mM, the plates are Parafilmed and allowed to soak for 1.5–2 hours. Odorant is aliquoted onto 5 agar plugs on the lid of adaptation plates (for benzaldehyde adaptation, 2 μL of 100% benzaldehyde is used; for butanone, 5 μL of 100% butanone is used). Between 100 and 300 animals are washed twice in S Basal and once in assay buffer (5mM KPO4 [pH6], 1 mM CaCl2, 1 mM MgSO4), then placed on an adaptation plate, and the plate is sealed with Parafilm. Animals are incubated in adaptation conditions for 90 minutes, then washed twice with S Basal and once with assay buffer and placed on chemotaxis plates. Chemotaxis is allowed to proceed for 1 hour, worms are counted, and a chemotaxis index is calculated. Adaptation is observed as a decrease in chemotaxis to an odorant after pretreatment with the odorant.
Chemotaxis assay plates are prepared as follows: 10 mLs of assay agar (2% agar, 5mM KPO4 [pH6], 1 mM CaCl2, 1 mM MgSO4 is aliquoted into 10 cm Petri plates, and allowed to dry overnight. The day of the experiment, all plates are dried at 37°C without lids for 1 hour. If ethanol is to be used in the experiment, one representative plate is melted to determine final volume, and ethanol is added to the desired final concentration (generally 200 mM). The ethanol plates are sealed with Parafilm, and ethanol is allowed to soak into the agar for 1.5 -2 hours. Between 100 and 300 animals are washed twice in S Basal and once in assay buffer (5 mM KPO4 [pH6], 1 mM CaCl2, 1 mM MgSO4). A spot of diluted odorant (for benzaldehyde, 1 μL of 1:200 benzaldehyde: ethanol) is placed on one side of the plate. Exactly opposite is placed a spot of diluent (1 μL ethanol). To each spot is added the anesthetic sodium azide (1 μL of 1 M sodium azide) to immobilize the worms when they reach a spot. Washed worms are then placed onto a spot on the plate that is exactly between the odorant and diluent spots and slightly off center. Excess liquid is wicked up with the corner of a Kimwipe. After 1 hour, worms are counted, and a chemotaxis index is calculated as follows: CI= (# of worms at the odorant spot - # of worms at the diluent spot)/ # of worms in the assay. A high chemotaxis index (close to 1) indicates that the odorant acts as a strong attractant, a lower chemotaxis index indicates that the odorant is a less effective attractant or does not act as an attractant.
Contributed by Andrew G. Davies and Steven L. McIntire, UCSF and Ernest Gallo Clinic and Research Center, San Francisco, CA, USA, March, 2005.
Cited in: Davies et al. (2003), Davies et al. (2004), and detailed in Davies and McIntire (2004).
Standard NGM agar plates (6 cm) are dried for 2 hours at 37°C without their lids. For quantitative locomotion assays, unseeded plates are preferable. Seeded plates should be used for egg-laying assays. For quantitative locomotion assays, the worms are first placed on unseeded plates containing no ethanol, so twice the number of plates to be used in the assay should be dried plus at least one more for use in calculating the volume of the media in each plate.
Determine the volume of the media in one of the dried plates by collecting the media into a 15 ml tube and melting it in a microwave for 10-15 seconds. Assume that all plates have the same volume of media (use plates poured in the same batch).
It is possible to test multiple strains on the same ethanol plate by using copper rings as corrals (#48 cap thread gaskets, 1.6 cm inner diameter; STK#35583, PlumbMaster, Concordville, PA). This approach helps to reduce some of the plate-to-plate variation. To do this, heat a copper ring in a flame for 1-2 seconds using forceps and place the ring on the surface of the plate. Apply a small amount of downward pressure on the ring so that it melts into the surface of the plate evenly, creating a seal when the agar solidifies. Three to four rings can be placed on a 6 cm Petri plate.
Ethanol at 4°C is then added to the dried plates. The volume of the agar from the melted plate is used to determine the volume of ethanol to be added. For instance, 232 μl of 100% ethanol is added to 10 ml of agar media to achieve a final concentration of 400 mM ethanol. The ethanol should be added outside of the copper rings, especially for seeded plates. Seal the plates with Parafilm and allow the ethanol to equilibrate in the media for 2 hours at room temperature.
Typically, 1st-day adult hermaphrodites are tested. Animals are synchronized by age by picking L4 stage animals 20-24 hours prior to the assay.
For locomotion assays, 10 worms of each genotype to be tested are transferred using minimal bacteria to one copper ring per genotype on unseeded plates containing no ethanol. The animals are allowed 30 minutes to become accustomed to a lack of food before being transferred without food to the assay plates. The plates are sealed with Parafilm and speed measurements are collected 10-50 minutes after the animals are transferred, typically after 20 minutes exposure. 3-4 genotypes (10 worms each) can be transferred in less than 2 minutes, which means that animals of different genotypes can be compared directly with minimal difference in the time of intoxication.
A quantitative measure of the speed of the intoxicated animals is measured by first creating a 2-minute time-lapse movie (1 frame per second) that includes all of the copper rings in the frame. This is don using a video camera attached to a computer with a video frame grabber and appropriate software for collecting images for a movie such as Openlab (Improvision). On a Apple computer, each genotype displayed in the movie can then be analyzed using the DIAS software application (Soll Technologies Inc.), which tracks each worm as a separate object from frame to frame and measures the distance traveled over time (average speed). As some genotypes move at different basal rates, calculating the speed of a strain on ethanol relative to its speed off ethanol can be useful for comparing strains.
Contributed by Eric Law and Derek Van Der Kooy, University of Toronto, Toronto, Canada, March, 2005.
We demonstrated that C. elegans is able to form an association between the presence of the odorant benzaldehyde and the food content of its environment. When exposed to 100% benzaldehyde for 1 h in the absence of food the naive attractive response is reduced. In contrast, the benzaldehyde attractive response is strengthened when animals are exposed to 100% benzaldehyde for 1 h in the presence of food. These results suggest that animals can form an association between the odorant benzaldehyde and food status (Nuttley et al., 2002).
Nematode strains were obtained from the Caenorhabditis Genetics Center at the University of Minnesota (St. Paul). All experiments used well fed adults cultivated at 20°C on standard nematode growth medium (NGM plates) seeded with E. coli strain OP50.
Assays were performed with standard 100-mm Petri dishes containing 6 m20/15g/liter agar). Where necessary, odorants were diluted in ethanol and l of CTX medium (10 mM Mops, pH 7.2/0.25% (vol/vol) Tween reported as percentages by volume. Plates were sealed with a strip of Parafilm around the edge during all odorant exposures. Briefly, 15 min before the assay 1 ml of 1 M NaN3 was applied to the centers of two test spots that were 6 cm apart. This acts as an anesthetic to immobilize any animals that reach the spot during the assay. Individuals (100-300) then were placed at the center of the plate between the two spots, 1 ml of the test odorant was placed at one spot, and 1 ml of ethanol was applied to the control spot. After 1 h of chemotaxis, animals within a 2-cm radius of either spot were counted, and a chemotactic index (CI) was calculated as the number of animals at the test spot minus the number of animals at the control spot and divided by the total number of animals on the plate. A positive CI indicates an attraction to the odor, and a negative CI indicates an aversion.
To measure the effects of pre-exposing animals to starvation-benzaldehyde pairing, 500-1,000 animals were placed on a CTX plate, and then 2 ml of the odorant were placed on a piece of Parafilm on the lid of the plate. The plate was sealed with Parafilm and then left inverted for 1 h. The animals then were rinsed from the test plate in approximately 2 ml of water and transferred to a conical centrifuge tube, where they were allowed to settle to the bottom of the tube. Within 5 min, the concentrated animals were collected and transferred to a fresh CTX plate for testing.
For assays involving food-benzaldehyde association on the CTX plates, cells from a 6X concentration of logarithmically growing E. coli culture were spread onto the plate and allowed to dry immediately before pre-exposure. A 1X concentration of E. coli was defined as an amount equivalent to 100 ml of culture diluted to an OD600 of 0.5. As with many food-related behavior, exogenous serotonin (5-HT) can substitute for food in this assay. For preparation, 5-HT salt (Sigma) was diluted in M9 buffer for a final concentration of 100mM. 100μL of this solution was spread onto the plate and allowed to dry immediately before benzaldehyde pre-exposure.
Contributed by Makoto Koga, Kyushu University, Fukuoka, Japan, March, 2005.
Assays are undertaken with well-fed, 1 day old adult animals raised at 20 degrees Celsius. Plates are closed during the assay che-1 and N2 animals are used as controls. The chemotaxis assay were performed essentially as described by Dusenbery et al. (1975) with some modifications (Uchida et al., 2003). A radial concentration gradient of NaCl is established by spotting 2μl of 5M NaCl to the center of 9cm plate containing 8 ml of agar medium [2% agar, 0.25% Tween20, 10mM HEPES(pH7.2)], and leaving the plate at room temperature for 12-16 hr. For the assay, the animals are placed on the surface of agar, 1 cm distant from the periphery and allowed to move freely for 1hr.
Contributed by Ikue Mori, Nagoya University, Nagoya Japan, March, 2005.
The experimental procedure of plasticity of chemotaxis to NaCl was reported by Saeki et al. (2001) and Ishihara et al. (2002).
The working bench should be horizontal. Avoid sources of wind and vibration such as a centrifuge machine or a draft chamber nearby. Do not use an incubator for the assay because it is strong source of wind of fan and vibration from compressor.
Room temperature should be kept at 25±1°C.
6-cm seeded NGM plates. Use a 6-cm plate containing 14 ml of NGM, which is minimal volume required for getting sufficient bacterial lawn. The NGM plates were spread with overnight-cultured E. coli, incubated for a day at room temperature (or for overnight at 37°C), and stored at room temperature. Do not use old seeded NGM plates (over 2 weeks).
Use the healthy adult animals from uncrowded plates. Animals should be maintained by transferring 2 to 3 animals to a new NGM plate before starving. Do not use the starved animals or those from a starved agar chunk.
Conditioning plate: The medium consists of 3% agar, 50mM NaCl, and 10mM pH 7.2 MOPSxNH4. After autoclaving, pour 8 ml of the medium exactly into a 9-cm plate. Store at 4°C and use in 3 weeks. (See Figure 3.)
Mock conditioning plate: The medium consists of 3% agar and 10mM pH 7.2 MOPSxNH4. After autoclaving, pour 8 ml of the medium exactly into a 9-cm plate. Store at 4°C and use in 3 weeks.
Assay plate: The medium consists of 2% agar and 10mM pH 7.2 MOPSxNH4. After autoclaving, pour 3∼3.5 ml of the medium exactly into a 6-cm plate. Store at 4°C and use in 3 weeks.
NaCl plug: The medium consists of 2% agar, 50mM NaCl, and 10mM pH 7.2 MOPSxNH4. After autoclaving, pour 6 ml of the medium exactly into a 6-cm plate. Store at 4°C and use in 3 weeks. To make NaCl-gradient on an assay plate, cut a plug (5 mm in diameter) from the 50mM NaCl plate and put a plug on one side of an assay plate for 19∼23 hr (Figure 4). After making NaCl gradient, discard the plug from assay plate before chemotaxis assay. You may use the Pasteur pipette (5 mm in diameter) to cut and put a NaCl-plug. Wash buffer: 0.5g per liter gelatin, 1mM CaCl2, 1mM MgSO4, and 25mM pH 6.0 potassium phosphate. Store at room temperature.
Collect well-fed animals with wash buffer.
Wash animals with wash buffer three times.
Transfer animals to the conditioning plate or mock-conditioning plate.
Place these plates with lids in the incubator at 20°C for 4 hr.
Collect conditioned or mock-conditioned animals with wash buffer.
Put animals on the center of an assay plate (50∼300 animals).
Leave the plates with lids for 15 min on the working bench.
Put several drops of chloroform on the lid to stop the animal.
Count the number of adult animals at each fraction, and calculate the chemotaxis index (Figure 4). You should not count clump worms on the midline of the assay plate because these clumps mainly contain wash-injured animals. Chemotaxis index is calculated as (A − B) / (A + B) where A was the number of animals on the NaCl side of the plate and B was the number of animals on the other side.
Contributed by Eric Law and Derek Van Der Kooy, University of Toronto, Toronto, Canada, March, 2005.
We demonstrated that olfactory adaptation (benzaldehyde-starvation learning) is taste context dependent. (Law et al., 2004) Animals adapted in a sodium acetate context require the same sodium acetate taste context for adaptation response. The same context effects can be observed if animals are trained in an ammonium chloride context or the standard NGM context.
All experiments used well-fed adults cultivated at 20°C on normal growth medium (NGM; 50 mM NaCl, 15 g/l agar, 20 g/l peptone, 1 mM cholesterol, 1 mM CaCl2, 1 mM MgSO4, 1 mM KPi [pH = 7.0]) seeded with the OP50 E. coli strain. Minimal medium was 15 g/l agar, 20 g/l peptone, 1mM KPi (pH = 7.0). CTX medium was 10 mM Mops (pH 7.2), 0.25% v/v Tween 20, 15 g/l agar with NaAc or NH4Cl added to a final concentration of 25 mM where indicated.
N2 worms received benzaldehyde adaptation training in either the NaAc or NH4Cl added to a CTX medium for a final concentration of 25 mM. Plates were poured one day before experiments and allowed to dry.
In a second set of experiments, we defined the contexts using the standard NGM context and a minimal context (with all the cues in the NGM context removed except for 15 g/l agar and 20 g/l peptone). The olfactory adaptation learning assay was carried out as described by Nuttlet et al. (2002).
Contributed by Ikue Mori, Nagoya University, Nagoya, Japan, March, 2005.
Thermotaxis is one of the interesting behaviors in C. elegans. This behavior, reported first by Hedgecock and Russell (1975), should require some mechanisms for sensing and memorizing temperature, which are still largely unknown. Thermotaxis is also a behavior difficult to assay, because this behavior is influenced by the environmental conditions including temperature, population density, and feeding status. Animals avoid temperatures at which they have been starved and accumulate at temperatures associated with food. However, the critical control of the environmental conditions enable us analyze this challenging behavior. This protocol describes a series of tips for thermotaxis (Ttx) assays (Mori and Ohshima, 1995).
Equipment and reagents: The working bench should be horizontal. There should be no source of wind and vibration nearby-such as a centrifuge machine or a draft chamber. Do not use an incubator for Ttx assays because it is strong source of wind of fan and vibration from the compressor.
Room temperature should be kept at 25 ± 1 °C. Avoid local temperature changes caused by sunlight. Low humidity (20 ∼ 30%) is preferred for assay.
Incubator to grow animals: A small volume (100 ∼ 150 L) incubator is preferred to get stable temperature.
6-cm seeded NGM plates. Use a 6-cm plate containing 14 ml of NGM, which is minimal volume required for getting sufficient bacterial lawn. The NGM plates were spread with overnight-cultured E. coli, incubated for a day at room temperature (or for overnight at 37°C), and stored at room temperature. Do not use old seeded NGM plates (over 2 weeks).
C. elegans: Use the healthy adult animals from uncrowded plates. Animals should be maintained by transferring 2 to 3 animals to a new NGM plate before starving. Do not use the starved animals or those from a starved agar chunk. To avoid crowding, you may transfer ∼ 15 of L4 larvae to a fresh and pre-incubated NGM plate. Grow those for 8 ∼ 24 hr (depend on cultivation temperature) and use for assays.
9-cm Ttx plates. Ttx medium consists of 2% agar, 0.3% NaCl and 25 mM potassium phosphate buffer (pH 6.0). After autoclaving, pour 8 ml of the medium exactly into a 9-cm plate. Store at 4°C and use within 2 weeks.
Vials filled with frozen glacial acetic acid (stored at 4°C). Glass vials are 10-cm long and 2.7-cm diameter. Freeze glacial acetic acid at -20°C and store at 4°C.
Remove lids of Ttx plates and dry the plates for ∼ 30 min at room temperature. Do not dry Ttx plates in a windy place like a clean bench or a draft chamber. Overdrying Ttx plates causes the plates' surface to become rough. The surface of Ttx plates should be smooth as a mirror.
Place the Ttx plates with lids upside-down; mark center and a point of 1.5 cm from edge.
Take the vials containing frozen glacial acetic acid out from cold room and leave the vials for 10 min at room temperature (25°C) to allow acetic acid starting to melt. The melting point of glacial acetic acid is 16.7°C.
Put the vial on the center of Ttx plate.
Leave the plates for 10 ∼ 15 min to form stable radial thermal gradient on the surface of Ttx plate. The thermal gradient is kept over 1 hr under the vial with melting glacial acetic acid. Renew the vials when the half of the glacial acid is melted.
Remove the vial and place an animal on the point of Ttx plate. Do not scratch the surface of the Ttx plate. Avoid bringing E. coli onto the Ttx plate. For example, move an animal to the place without bacterial lawn in NGM plate (or unseeded NGM plate) and transfer the animal to the Ttx plate.
Put the vial on the center of Ttx plate again.
Leave the plates for 50 ∼ 60 min. Do not walk around during assay to avoid wind and vibration.
Remove the vial and put several drops of chloroform on the lid to stop the animal.
Place the Ttx plates at 4 °C until photographed.
Equipment and reagents
9-cm starvation plates. The medium consists of 2% agar, 1mM CaCl2, 1mM MgSO4, and 25mM pH 6.0 potassium phosphate. After autoclaving, pour 8 ml of the medium exactly into a 9-cm plate. Store at 4°C and use in a month.
NG buffer. NG buffer consists of 0. 3% NaCl, 1mM CaCl2, 1mM MgSO4, and 25mM pH 6.0 potassium phosphate.
Procedure 5. Starvation method 1
Incubate NG buffer and starvation plates at the temperature for assay over 3 hr.
Collect well-fed animals with pre-incubated NG buffer.
Wash animals with NG buffer twice in the water bath at the temperature for assay.
Transfer animals to the pre-incubated starvation plate.
Seal the starvation plate with Parafilm.
Incubate at the temperature for assay for appropriate time (at 17°C for 2 ∼ 3hr or at 25°C for 30 min).
Contributed by Will Ryu, Chris Gabel, Aravi Samuel, Harvard University, Cambridge, MA, USA, March, 2005.
C. elegans crawling is characterized by a series of forward movement punctuated by occasional backward movements and abrupt turns. A swimming worm suspended in a microdroplet will also execute these movements spontaneously. There are several advantages to studying worm behavior by examining swimming patterns in microdroplets: 1) The movements of a single worm can be monitored for an extended period of time using a stationary video camera. 2) Thermal stimuli are easily delivered to the microdroplet. 3) The movements of the swimming worm can be quantified objectively using machine vision software.
We have developed a microdroplet-based thermotactic assay that effectively quantifies the behavioral output of individual swimming worms responding to defined thermal stimuli. (Ryu and Samuel, 2002; Satterlee et al., 2004; Figure 5).
The thermal stage is designed for use on an inverted microscope. The worm swims freely in a microdroplet sandwiched between a cover slip from above and a round sapphire window from below. The typical microdroplet contains ∼0.5 μL of NGM buffer (same salt concentrations as NGM media) that flattens to a circular droplet ∼2 mm in diameter and ∼300 micrometers in thickness within which we place a single young adult worm. (For monitoring the swimming behavior of a single worm in the microdroplet, a low magnification objective (1-4x) is useful. But this thermal stage can also be used for physiological measurements of neuronal activity using high-numerical aperture objectives.)
The single-crystal sapphire window (15.9 mm diameter, 1 mm thick; Rolyn Optics, Inc) is embedded in a slab of copper such that the upper surfaces of the sapphire and copper are flush. We use copper and single-crystal sapphire because of their excellent thermal conductivities. A microthermocouple - either embedded in the copper near the window or in contact with either the sapphire or the droplet itself - is used to continuously monitor the actual temperature and to provide feedback to the control electronics. A suitable thermocouple is the IT-23 Teflon-coated Type T thermocouple made by Physitemp Instruments Inc.
A Peltier-effect 85 Watt thermoelectric element (5 cm x 5 cm) sandwiched between the copper stage and a brass, water-cooled heat sink provides feedback-controlled heating/cooling. The thermoelectric controller we use is the Thorlabs TEC2000 (Thorlabs, Newton, NJ), which provides adequate power and straightforward computer interfacing, but many other options exist. To minimize the temperature gradient across the Peltier element (and thus the power the thermoelectric controller has to deliver), we also use a temperature-controlled water bath (Model 1160S Heated/Refrigerated Circulator, VWR) to fix the temperature of the heat sink to an intermediate value of the actual experiments.
An alternate microdroplet configuration consists of suspending 50 μL of NGM buffer from a 4 mm diameter hole in an temperature controlled anodized aluminum plate. The top of the hanging droplet is covered with a glass coverslip and the bottom of the droplet is left exposed. The microdroplet can be imaged from above using a video camera with a zoom lens or a stereomicroscope. Worms swim naturally but remain in the center of the droplet due to the droplet's curvature. There is some evaporative loss, but if the droplet volume is maintained, a single worm can be studied for many hours.
We have written software in the LabVIEW programming environment (National Instruments, Austin, TX) to simultaneously control and monitor the temperature of the droplet and also capture images of the worm. Thermal stimulation of the swimming worm is achieved via defined voltage waveforms sent to the thermoelectric controller, using a multifunction data acquisition card [PCI-6024E]. Movements of the worm swimming in the microdroplet are imaged with a CCD camera and captured to the computer with a PCI-1407 Image Acquisition card. We find that a simple and effective metric of behavioral performance is the nose-to-tail distance of the swimming worm. During forward swimming, bending waves propagate from nose-to-tail and the nose-to-tail distance oscillates just below the contour length of the worm. During reorientations (either sharp turns or reversals), the nose-to-tail distance decreases significantly. (See Figure 6 and Figure 7).
We wrote image-processing software to calculate the nose-to-tail distance of a swimming worm using the LabVIEW Vision Development Module. Since the software works best with a high-contrast image, we typically used dark-field illumination for the microdroplet supplied by an LED ring or a fiber-optic gooseneck lamp set at an oblique angle. For each video frame, a background subtraction and threshold was used to eliminate debris or uneven illumination from each image. The centerline of the worm was then calculated using a skeletonize algorithm. The absolute distance between the end-to-end of the centerline is then calculated for each video frame. Typically, we use a frame rate of 1-5 Hz. High frame rates are suitable if one wants to calculate the rate of bending waves, which will emerge as the high frequency component in the oscillation of end-to-end distance. Reorientation events are detected in each experiment by flagging significant dips in the nose-to-tail distance over the time course of each experiment.
The cryophilic response of the worm thermotaxis is straightforward to measure using the microdroplet assay. In earlier work, we found that when worms navigate at temperatures warmer than their cultivation temperature (Tcult), increasing temperature stimulates reorientations and decreasing temperature suppresses reorientation (1). The cryophilic response dominates worm movements when worms swimming in a microdroplet are subjected to thermal oscillations.
In order to set the memory of Tcult, we grow worms overnight on NGM plates containing an ample lawn of OP50. A single worm is picked from the plate, rinsed in an NGM buffer (containing the same salt concentrations as the plate), and then picked to the microdroplet. Thermal cycles around ambient temperatures warmer than Tcult (e.g., cycling temperatures between 23-24°C for T-cult-=20°C) will stimulate reorientations during the warming phase and suppress reorientations during the cooling phase. By cycling the temperature several times for each worm, it is possible to perform a robust measurement of the stimulus-response relationship for an individual worm. By measuring the ambient temperatures at which the cryophilic drive is active, it is also possible to use the microdroplet in a 'memory assay' to quantify the set-point of T-cult in a single animal.
The main limitation of the microdroplet assay for thermotaxis is that a correlate of isothermal tracking has not yet been detected. During isothermal tracking, an individual worm persistently zigzags along each isotherm in a spatial thermal gradient. One possibility is that the uniform temperature of the microdroplet could not support a correlate of isothermal tracking that might require a spatial thermal gradient. Another possibility is that the behavioral response is subtle and might also require a stimulus pattern that more closely matches the thermal experience of a worm tracking an isotherm (e.g., alternating upward and downward steps of ∼0.1°C every 10-20 seconds).
The automated analysis of behavioral responses of single swimming worms has accelerated studies of thermotaxis (2). The machine-vision analysis of movements of single worms in microdroplets is a general technique, which can easily be implemented in other studies, e.g., measurements of spontaneous reorientation, bending wave frequency.
Contributed by Will Ryu, Chris Gabel, Aravi Samuel, Harvard University, Cambridge, MA, USA.
Conventional methods for studying worm thermotactic migration utilize frozen glacial acetic acid as a cold source and an incubator as a hot source to create spatial thermal gradients on agar plates. (See preceding protocol, Mori and Ohshima, 1995). We have developed an alternative approach utilizing a simple linear thermal gradient apparatus that utilizes Peltier-effect thermoelectric elements to produce highly reproducible and stable gradients on agar plates with simultaneous monitoring of worm movements using video microscopy.
We establish a thermal gradient across an anodized aluminum slab (4"x9"x1/4") by affixing 160W thermoelectric elements on each end. Each thermoelectric element is sandwiched between the aluminum slab and its own brass heat sink. Water is continuously circulated through both heat sinks by a temperature-controlled water bath (Model 1160S Heated/Refrigerated Circulator, VWR). The thermoelectric elements create a thermal gradient across the middle of the slab, atop which can be placed a 9 cm agar plate. A few drops of glycerol between the plate and the top surface of the slab ensure thermal contact. The agar plate is covered to isolate the surface from air currents. To prevent condensation build-up, the cover of the agar plate is coated with a thin layer of liquid detergent (Figure 8).
Separate feedback loops are needed for both thermoelectric elements. We use separate calibrated thermistors embedded in the agar slab at the “hot” and “cold” edges of the gradient. Each thermistor and Peltier-effect thermoelectric element is connected to its own thermoelectric controller. The amount of power needed for steep gradients (1°C/cm) exceeds the operating range of two Thorlabs TEC2000s (Thorlabs, Newton, NJ). One option is to use two Oven Industries Model 5C7-195 thermoelectric controllers (Oven Industries, Mechanicsburg, PA) with external power supplies with the proper power rating (>160W). Another option is to use Wavelength electronics MPT10000 Chassis Mounted Thermoelectric modules (Wavelength electronics, Bozeman, MT), although these modules are not 'stand-alone' devices and require assembly into an electronic instrument (e.g., RIS-549 made by the Electronic Engineering Laboratory at the Rowland Institute at Harvard).
The temperature gradient at the agar surface will be less steep than the gradient across the aluminum slab, and needs to be verified with each setting of the thermoelectric elements. This can easily be done using a hand-held digital thermometer (e.g., Fluke 50 Series) with a T-type thermocouple.
Uniform illumination and high-contrast images are necessary to visualize worms navigating the linear thermal gradients. We have engineered a simple dark-field illuminator using a ring of 48 superbright light-emitting diodes in the same plane as the agar plate. Using fresh, clean plates without surface defects, the only light-scattering objects are the worms themselves. These high-contrast images of the worms can be recorded using a CCD camera (e.g., Panasonic WV-BP554) equipped with a zoom lens (25 mm) that captures the image of the whole plate.
We use a PCI-1407 Image Acquisition card to grab frames from the CCD camera of worms executing thermotactic migrations along the surface of the agar plate. In this way, we can measure overall thermotactic drift upwards or downwards on the thermal gradient as well as score individual movements like forward crawling, backward crawling, and turns. We have written simple particle-tracking algorithms using LabVIEW Vision Assistant to measure individual crawling trajectories.
Measurement of thermotactic migration requires setting the worms to a particular cultivation temperature (Tcult). When placed on a spatial thermal gradient, worms will track isotherms in a band of temperatures near Tcult. Worms can be set to a specific Tcult by growing them overnight at Tcult on an NGM plate with OP50. The day of the experiment, several young adult worms should be rinsed in NGM buffer and picked to a fresh NGM plate, which should then be transferred immediately to the linear thermal gradient. It is necessary to cover the plate. Usually, the thermal gradient will equilibrate after 3-4 minutes, and isothermal tracks should emerge among the worms navigating at temperatures near their Tcult (Figure 9).
C. elegans avoidance of very high temperatures can be induced by heating a scalpel or pick-then holding the heat source near the animals nose. Animals rapidly initiate backward locomotion. A soldering iron can also be used. This response is called “Thermal avoidance” (Tav). A diode laser has been used by the Baumeister laboratory to study thermal avoidance (Wittenburg and Baumeister, 1999).
Contributed by Niels Ringstad and Bob Horvitz, written by Michael Koelle, and inspired by Beth Sawin, MIT, Cambridge, MA, USA, March, 2005.
To make results comparable, it is important that the assays always be done exactly the same way!
Pick 10 late L4 animals from an unstarved plate to fresh plates, one worm to a plate. By picking fat L4s with large white vulval crescents with a tiny black dot in them (as viewed in the dissecting scope) you can get very accurately staged animals. For sick genotypes, may need to pick more than 10 animals to have 10 healthy ones surviving the next day. It's best to use freshly seeded plates with fairly thin lawns. I used plates that were seeded the previous afternoon, and left to grow overnight at 37° in a covered box.
24 hours later (±1 hour) begin the assays.
I've been doing the assays at room temperature (22°) but doing them in the 20° constant temperature room would probably be more careful.
Gently place a plate on the dissecting scope (so as not to mechanically stimulate the worm). Start a 3 minute timer, and begin counting body bends. Every time the part of the worm just behind the pharynx reaches a maximum bend in the opposite direction from the bend last counted, advance the count one. For example, if the worm moves forward, then spontaneously reverses, and the region just behind the pharynx bends again the same direction it had just bent when the worm had moved forward, that doesn't count! Wait until the worm actually bends the other way to advance the count.
Worm movement changes if the animal reaches the edge of the bacterial lawn. I do not use measurements if the animal dawdles at the edge of the lawn for more than about 15 seconds during the three minute period. If an animal is at the edge of the lawn, put the plate aside for a few minutes and come back to it for measurement when the worm is away from the lawn edge.
Count the other 9 worms the same way.
Calculate average body bends per minute for each worm by adding up the body bends counted for that worm over the entire 9 minutes of measurement, and dividing by 9. Calculate an average and standard deviation for the genotype being measured using the 10 values obtained for the 10 individual worms measured. To give an idea of the size of the standard deviations I get using this method, here are some values I measured (per 3 minutes):
I prefer this measure of locomotion to others that have been used. The actual distance a worm moves per time may be influenced by the number of eggs it carries, the thickness of the bacterial lawn it is on, number of direction reversals the worm makes, etc. Counting the number of body bends seems to me to be a more direct measure of the effort the worm is making to move which should be less influenced by these factors.
I always carry out all assays to be compared on the same day, using the same batch of plates, so as to minimize any systematic errors that might be introduced by using different batches of plates.
Contributed by Niels Ringstad and Bob Horvitz, adapted from Sawin, Ranganathan and Horvitz (Sawin et al., 2000) by Dan Omura, MIT Cambridge, MA, USA, March, 2005.
Assay plates are prepared by spreading the E. coli strain HB101 in a ring with an inner diameter of ∼1 cm and an outer diameter of ∼3.5 cm on NGM agar in 5 cm Petri plates. Lawns can be spread using the smooth bottom of a small culture tube. Assay plates are always freshly spread with bacteria, incubated overnight at 37°C, and allowed to cool to room temperature before use. Lawns should not be overgrown and should have a slightly textured, not glossy, appearance. Plates for measuring locomotory rate in the absence of bacteria are also incubated at 37°C. Only synchronized young adult hermaphrodites (12-21 hr after the late L4 larval stage) are tested.
For well-fed animals, locomotory rate is measured by gently picking 5 animals from plates with ample bacteria, washing the animals twice in 1 ml S basal buffer in a 24 well flat bottom tissue culture plate using a capillary pipette, and transferring them to an assay plate in a drop of buffer. If the assay plate contains a ring-shaped bacterial lawn, the animals are transferred to the clear zone in the center of the ring. The buffer used to transfer the animals is carefully absorbed with a Kimwipe. Five minutes after transfer, the number of body bends in 20 s intervals is measured for each of the 5 animals on the assay plate.
To food-deprived animals, 5-15 animals are washed free of bacteria in S basal buffer (two washes) and then transferred to 5 cm NGM agar plates with no bacteria and a ring of 4M fructose on the outer edge. The fructose ring prevents animals from crawling off of the plate and is easily made by holding the plate at an angle, dripping 2-3 drops of fructose at the edge of the plate, and rotating the plate. To make the high osmolarity ring visible, add a small amount of bromophenol blue to the fructose solution. The animals are gently dried with a Kimwipe and incubated on these plates for 30 min at room temperature. At the end of 30 min of food deprivation, five worms are gently transferred in a drop of S basal buffer to assay plates, and locomotory rate is measured as described above for well-fed animals.
Locomotory rate measurements for mock and laser-ablated animals are done in a similar fashion, except that only 1 animal is transferred to each assay plate. Its locomotory rate is tested in the presence of bacteria, and it is then allowed to recover for 2-3 hr on plates containing bacteria and then transferred, as described above, to food deprivation plates. After 5 min on the food deprivation plates, the locomotory rate of these well-fed animals in the absence of food is recorded; these locomotory rates are not different from locomotory rates on regular assay plates without bacteria that do not have the high osmolarity ring (data not shown). After 30 min, the food-deprived animals are transferred to assay plates containing ring-shaped bacterial lawns, and the locomotory rate is again recorded.
C. elegans normally disperses across a bacterial lawn, but mutations in specific genes or specific environmental conditions can induce animals to aggregate or form “clumps” just inside the edge of the bacterial lawn. This behavior is historically called “bordering” or “social behavior”. Decreased function of the npr-1 neuropeptide receptor or associated ligands induces bordering. (de Bono and Bargmann, 1998) Bordering can be induced by decreasing oxygen levels. Bordering can be quantified on NGM plates containing 2.1% agar seeded 2 days before the assay with 200 l of E. coli OP50 in LB medium to generate a circular lawn about 25 mm in diameter. Approximately 120 well-fed adult worms from uncrowded plates are picked onto this lawn and left at 20°C for 3 hr. (Do not disturb the plates during the incubation period; avoid mechanical perturbations like vibration or tap.) After 3 hr, clumping behavior can be measured by calculating the fraction of animals in contact with two or more other animals along at least 50% of their body length. At the same time,bordering behavior can be measured by calculating the fraction of animals that resided within 2 mm of the edge of the bacterial lawn.
Contributed by Joseph Dent, McGill University, Montreal, Quebec Canada, March, 2005.
Reversal behavior refers to the tendency of the worms to change their mode of locomotion from forward to backward by changing the direction of propagation of the sinusoidal body waves. Reversals can be induced, as when an acute stimulus such as touch produces an immediate reversal, or spontaneous as when the worm reverses in the absence of an acute stimulus. Spontaneous reversals reflect the integration of many aspects of both the environment and the internal state of the worm and therefore can be a sensitive measure of behavioral state.
There are two methods for scoring reversals: human observation and computer vision. Human observation involves watching a worm, typically under a dissecting microscope and counting the number of times they reverse. (Chiba and Rankin, 1990; Croll, 1975) The scoring can be aided by making a video record of the assay. Reversals run the gamut from a stutter in the forward locomotion that lasts less than a second to several seconds of backward movement, so one must operationally define what constitutes a reversal. The specific definition of a reversal is less important then its consistent application. One convenient definition for human observation is any retrograde movement that is greater than the length of the pharynx. This has the virtue of being easy to gauge and, because the pharynx is proportional to the size of the worm, is less dependent on the size of the worm.
Computer vision applications typically involve a camera mounted on a microscope, connected to a frame-grabber and image analysis software, which are in turn connected to a motorized stage. (Pierce-Shimomura et al., 1999) The image analysis software identifies the silhouette of the worm, determines how far the worm has moved since the last image was taken and commands the stage to re-center the worm in the field of view. The record of the movements of the stage is also a record of the movements of the worm. Updating the stage every second is generally a high enough sample rate to catch most reversals although some very brief reversals may be missed. (Pierce-Shimomura et al., 1999; Zhao et al., 2003) Alternatively, the worms can be recorded under low magnification with no movement of the stage and their position in the field of view recorded at each time point. To reduce computational demands, the position of the worm is usually abstracted to its centroid. Reversals are defined as changes in the bearing of the centroid (determined by the angle between the line segments defined by successive pairs of data points) greater than a certain angle, e.g., >50° (Pierce-Shimomura et al., 1999). However, the centroid can be misleading, especially when the worm is significantly bent as in the case of an omega turn, resulting in false positives and negatives. It is important to visually confirm the result of at least a sample of the reversals scored by the computer. More recently, software has been developed that abstracts the worm as a series of line segments along the midline (Baek et al., 2002; Feng et al., 2004). In principle, this should result in more accurate scoring of reversals. Various combinations of hardware have been employed for worm tracking (Hardaker et al., 2001; Pierce-Shimomura et al., 1999; Zhao et al., 2003). Software is often written by the authors and available on request (Feng et al., 2004).
Although a researcher can score one worm out a population on a plate, it is often advantageous to place worms individually on an assay plate and score them one at a time. This is because, whether scoring by eye or by computer, it is essential to control the state of the worm and its environment as much as possible. Among the variables that can affect reversal frequency are: temperature, humidity, wetness of the agar, presence of food, age of the worm, sex of the worm and gravidity of the worm (Zhao et al., 2003). A worm will also reverse if it bumps into another animal. Moreover, computer vision applications used so far only track one worm at a time. By scoring L4 larvae one can minimize the effects of age and gravidity. To control for other effects, it is useful to assay control and experimental populations on the same day using the same agar plate, preferably by alternating experimental/mutant and control worms (Zhao et al., 2003; Zheng et al., 1999).
Although one can measure reversal frequency simply as the number of reversals in a given period of time, it can be more informative to score the reversal interval, i.e. the time between reversals. By plotting a histogram of reversal intervals, one finds that the resulting distribution can best be fit by a lognormal function (Hardaker et al., 2001; Zhao et al., 2003), or the sum of two exponentials (Brockie et al., 2001; Pierce-Shimomura et al., 1999). The parameters of these distributions can vary significantly with the experimental conditions, providing information about how the probability of reversal varies over time or among populations in different behavioral states.
Reversal frequency can be measured in response to various experimental manipulations. These include: the presence of a source of chemo-attractive compounds (Pierce-Shimomura et al., 1999), the presence of drugs (in the agar) and mechanical stimulation (Zhao et al., 2003). Mechanical stimulation with an eyelash or pick requires that the lid be left off the plate; in this case care must be taken to avoid air currents that can stimulate the worms to reverse.
Reversal duration/distance, how long the worm spends in retrograde locomotion for a given reversal and how far it moves backward, are also sensitive indicators of the state of the worm. A video record of the animal's behavior traced onto acetate or a computer vision application can be used to measure the duration of a reversal and its distance (Chiba and Rankin, 1990). Reversal duration can also be scored visually with a timer and the reversal distance estimated by counting the number of body bends generated while the worm is reversing. Body bends are generally an accurate measure of distance for worms of approximately equal size. As above, control of the environment is essential to get consistent results.
Contributed by Joseph Dent, McGill University, Montreal, Quebec, Canada, March, 2005.
Ivermectin is an antiparasitic drug that affects nematodes including C. elegans. It activates glutamate-gated chloride channels which in turn inhibit a variety of excitable cells including the pharyngeal muscle and neurons involved in locomotion (Cully et al., 1994; Dent et al., 2000). Because ivermectin prevents pharyngeal pumping, one effect of ivermectin is to cause the animals to starve. Ivermectin-induced paralysis of locomotion appears to be an effect of ivermectin on the neuronal circuit controlling locomotion rather than on the muscles themselves. Both the locomotion and eating phenotypes have been used to measure sensitivity to ivermectin.
Prepare stock a solution of the ivermectin (e.g., 10 mg/ml, Sigma-Aldrich, St. Louis, MO.) in 100% DMSO. Prepare drug plates at desired concentrations (EC50 for wild type worms is ∼1 ng/ml) by adding 1% DMSO and then ivermectin from a stock solution to melted NGM agar. For dose response curves, which require preparing plates at many drug concentrations, we prefer to pour 35 mm plastic Petri dishes. Seed plates with bacteria a day or two in advance. If only testing a few drug concentrations, pick eggs from the strain of interest directly onto the drug plate. If many drug concentrations are to be tested, egg prep the strain of interest using alkaline bleach and resuspend eggs from one 60 mm plate in ∼1 ml sterile M9 buffer. Estimate the concentration of eggs by placing ∼30 ml of suspension from a well shaken tube (always re-shake the suspension because eggs will settle), put on an agar plate and count the number of eggs. Try to have between 50 and 100 eggs per 30 ml; dilute suspension if necessary. Pipette 30 ml of egg suspension per drug plate. Be sure to include control plates lacking drugs (ideally with 1 % DMSO although in practice the DMSO seems not to have much effect). Allow worms to grow for 3-4 days and score growth. A simple method of scoring growth is to count the number of hermaphrodites that have become gravid adults, although there is any number of criteria one could use to measure growth. It is essential however to include negative controls (no drug) against which to normalize the data. We typically score 6 plates per ivermectin concentration using at least two different egg preps. The growth assay is most sensitive to pharyngeal function and primarily reflects the effect of ivermectin on feeding (Dent et al., 2000).
To measure effects of ivermectin on locomotion, a motility assay can be used. (Arena et al., 1995) Wash worms off of plates with 25 mM HEPES buffer and incubate in liquid with drug up to 16 hours. Score the percentage of worms that are still thrashing in liquid.
Contributed by Shawn Lockery, University of Oregon, Eugene, OR, USA, March, 2005.
C. elegans locomotion involves bouts of forward locomotion punctuated about twice a minute by episodes of turning that have been termed “pirouettes” (Pierce-Shimomura et al., 1999). Pirouettes appear to be the final common path for approach behaviors such as chemotaxis, and avoidance behaviors such as the response to high osmolarity. Because the efficiency of either type of behavior depends on the change in orientation produced by individual pirouettes, it is often of considerable importance to quantify the effects of pirouettes on the direction of locomotion.
Pirouettes are defined in terms of omega turns and reversal turns, here collectively referred to as “sharp turns”, and the intervals between them called “runs”. The study that originally proposed the concept of a pirouette (Pierce-Shimomura et al., 1999), noted that the distribution of run durations was well fit by the sum of two exponentials, suggesting that there are two distinct kinetic states, one that emits mainly short runs and another that emits mainly long runs. Pirouettes were defined as either a single sharp turn or a series of sharp turns each separated from its neighbors by short runs. Because either type of run state is theoretically capable of generating a short or long run, it is not possible to definitively assign a run of a particular duration to one state or the other. However, one can minimize the number of classification errors by computing a critical run duration, called tcrit, below which a run is assumed to be generated by the short run state. The equation for tcrit is shown in Figure 10 where Al and A s are the respective amplitudes of the long-and short-run exponential components and l and s are their respective time constants. In the original study, tcrit was found to be approximately 6 sec, but tcrit is likely to be different in different types of experiments. A first step therefore in any study of turning behavior will be to obtain the distribution of run durations under appropriate experimental conditions, and to compute the value to tcrit to be used in the analysis of data generated under these conditions.
The following summarizes the steps required to identify pirouettes and to measure their effects on orientation.
Record the location of the worm's centroid at a rate of at least 1 sample per second. This requires an automated tracking system with enough spatial resolution to clearly define the direction of locomotion at this sampling rate.
Convert this record to instantaneous turning rate vs. time, R (t). This is done by computing the (minimum) change in angle between the velocity vector defined by sample points at t -1 and t, and the velocity vector defined by sample points t and t + 1. The change in orientation is converted to a rate by dividing by the sample interval.
Identify sharp turns in the recording by noting the times at which |R (t)| exceeds a threshold of 50 deg/sec. It is advisable to verify and possibly revise the threshold in accordance with different strains and plate conditions. This is done by comparing sharp turns identified in videotapes by eye the R (t) trace of the same worm.
Identify pirouettes. A pirouette is as an isolated sharp turn, or a sharp turn burst. A burst begins when the interval between two consecutive sharp turns is > tcrit. A burst ends when the interval to the next sharp turn is ≥ tcrit. As discussed above, tcrit depends on the distribution of run durations. Because this distribution is likely to be different in different experiments, it is advisable to compute it anew for each data set.
Compute than angle change associated with each pirouette. This computation depends on the reference frame appropriate to the experiment. For chemotaxis in a radial gradient, for example, the reference frame is the gradient. The change in angle produced by a pirouette is the change in the worm's bearing relative to the gradient peak. Bearing is defined as the angle between the velocity vector of the worm and the vector defined by connecting the worm's location to gradient peak; the change in bearing is defined as the difference between the bearing vectors immediately before and after the pirouette. For other studies, such as those concerning spontaneous locomotion, the reference frame is likely to be the worm itself. In this case one merely takes the difference between velocity vectors immediately before and after the pirouette.
C. elegans spontaneous locomotion decreases during the dauer stage and decreases at specific intervals at each larval molt. Relatively little is known about the mechanisms involved.
This description is adapted from the literature. (Brockie et al., 2001; Zheng et al., 1999) Animals are grown at 20°C-21°C on E. coli strain OP50 under standard conditions. Individual first day adults are transferred to assay plates using a glass pick from culture plates to standard NGM agar plates lacking food. Care should be taken to ensure that no bacteria are transferred with the animals. Each animal is observed for about 7 min, and a computer program keyed by the operator can be used to record the duration of forward and backward movements. Average duration times can vary between experiments, presumably due to variables like humidity, dryness of plates, etc. All of the strains that needed to be scored should randomized and scored on the same day. And, all movement assays should be scored by an observer who is blind as to genotype or treatment. Forward and backward durations can be reported as mean ± SEM, and the significance of the differences can be evaluated using the Student's t test.
Velocity can be determined from calibrated, videotaped recordings of movements on unseeded NGM agar plates. Average velocity is defined as the total path distance (mm) per time (s).
Reversal frequency is obtained by counting the total number of movement reversals per minute; it can be calculated from the forward and backward duration: reversal frequency per MIN = 1/([forward time + backward time]/2).
Contributed by Niels Ringstad and Bob Horvitz, written by Mark Alkema, MIT, Cambridge, MA, USA, March, 2005.
Attach a very fine eyelash or hair of a fine sable hair paint brush (watercolor) to the very end of Pasteur pipette with Scotch tape.
Stroke young adults with the hair behind the posterior bulb of the pharynx. The anterior touch induces a backing response. Score the presence or absence of head oscillations during the backing response. Score animals that make at least 2 backward body bends (one sinusoidal wave) to make sure that the animal responds to the anterior touch. Wild type animals suppress their head oscillations during the backing response. In the wild type, head oscillations resume as soon as forward locomotion is reinitiated. tdc-1 mutants fail to suppress head oscillations during this backing response and can be used as negative control in this assay. The suppression of head oscillations is most easily scored in animals that are outside the bacterial lawn or on a fresh thin bacterial lawn.
Animals that show no head oscillations during backward locomotion were scored as wild-type. A single animal can be tested at least 3 consecutive times with no obvious extinction in the suppression of head oscillations.
Contributed by Niels Ringstad and Bob Horvitz, written by Megan Higginbotham, MIT, Cambridge, USA, MA, March, 2005.
Dissolve serotonin (serotonin creatinine sulfate complex, Sigma) in M9 to the desired concentration by vortexing.
Aliquot 200 microliters per well (96 flat bottom well tissue culture plates, Falcon).
Pick 20 animals (staged, approx. 24 hrs post-L4) to well.
Count immobilized animals after each minute for desired number of minutes.
A detailed description of this can be found at http://eatworms.swmed.edu/Worm_labs/Avery/MiniRig/.
Pumping rate are measured by counting visible movements of the grinder. (Raizen et al., 1995).
Normal rates are almost too fast to count, but decreased pumping rates can be readily counted. Note that in normal animals pharyngeal pumping is decreased off food.
See “Head withdrawal and foraging” in the Mechanosensation section.
Contributed by Michael Koelle, Yale University, New Haven, CT, USA, March, 2005.
The number of eggs that accumulate inside an adult is a function both of the rate of egg production and the rate of egg-laying. If you want to use this assay to quantify differences in the rates of egg-laying between various strains, you have to first be certain that the strains you're assaying have a similar rates of egg production. In practice, I do this by measuring brood sizes on all the strains being analyzed to make sure they are similar.
The number of eggs inside an adult varies with age, so staged adults must be used to get meaningful numbers. Stage the animals by picking late L4 larvae to a new plate. They are recognized by a white crescent in the presumptive vulval region, which acquires a black central dot in late L4. Also, late L4 are fatter than early L4. Animals thus staged should be within a few hours of each other in development. Put the staged animals back in the incubator, and count after the desired aging has occurred. The number of eggs in most genotypes peaks around 44 hours after late L4 at 20°. I usually assay the animals at 36 hr after late L4 at 20°: this is just before the time when severely Egl worms begin to have hatched larvae inside of them. These hatched larvae tend to damage the mother's gonad, interfering with the production of eggs. The number of eggs inside a worm containing hatched larvae therefore does not necessarily reflect the rate at which eggs have been laid; it is skewed by this damage to the gonad. I never use egg counts from worms containing hatched larvae.
To dissolve the worms, but not the fertilized eggs, use 20% sodium hypochlorite (NaOCl) in water. This is sold by Aldrich, cat. #29,930-5. Store the 100% stock in the refrigerator. I keep 10 mls of 20% ready for use in a capped tube at my bench. Dispense 50μl per well into a flat well bottom microtiter dish. I've been using “Costar” brand “cell culture cluster dishes”, which are very clean. Note: NaOCl goes bad after a while; the 20% solution should be thrown out after about a month, and even the refrigerated concentrated stuff eventually goes bad.
Put one worm in each well. Do this at the dissecting scope using the 12X objective, using a worm pick to transfer animals from plates to the microtiter dishes. It takes 8-10 minutes for the hypochlorite to dissolve most adults without affecting mature eggs. In practice, I pick 20 worms to wells, which takes about 8 minutes, count those worms, and then pick more. Don't wait longer than ∼20 minutes because eventually hypochlorite will dissolve the eggs too.
To count the eggs, move to a higher power scope. This aids in identifying eggs versus dissolved bits of adult worm, and allows eggs to be staged if early versus late eggs are being counted. Two types of scopes can be used. The Makroskop (high power dissecting scope) is nice because you can use a zoom lens, it is in the right magnification range, and there is space above the dish to use a worm pick to mechanically disrupt worms that haven't been lysed by the hypochlorite adequately. Unfortunately, the optics around the edges of the microtiter wells are terrible with the Macroskop, and eggs on the edges of the wells will be invisible. If the Makroskop is used, it is important to place the worms in the center of the wells, and be careful not to bump the dish and move eggs to the edge. The better option is to use a low power inverted scope. A tissue culture style scope is ideal, but worm labs don't have these. A microinjection scope can be used. Just remove the injection needle, and the clips that are normally used to hold the slide on the stage. Then use 5X and 10X objectives, and swing out the polarized light filter. A reasonable image of the whole microtiter well can be had.
Ideally the adult will be almost completely dissolved, and a pile of eggs will remain to be counted. This works better in some genotypes than others. For example, cat-4 adults dissolve almost immediately, many Egl mutants dissolve okay, and N2 is difficult to dissolve; often the N2 cuticle remains around the bunch of eggs making it difficult to resolve exactly the number of eggs in the tightly packed cluster. This problem is overcome by just letting these worms soak in hypochlorite for an extra 5 minutes.
There is a fair amount of variation between individual worms, so I always count at least 10 worms of a given genotype to get a meaningful average.
Contributed by Michael Koelle, Yale University, New Haven, CT, USA, March, 2005.
To make results comparable, it is important that the assays always be done exactly the same way!
Pick about 25 late L4 animals from an unstarved plate to a fresh plate.
36 hours later (+ or − 0.5 hours), pick 20 animals to a fresh plate. You will necessarily transfer some eggs with the animals. Let the animals crawl away from these eggs for a few minutes, and then pick them again to a fresh plate, this time making sure that no eggs are transferred.
Set the animals at 20° for exactly 30 minutes. There should be 25-100 eggs on the plate.
Stage the freshly laid eggs using a Wild Makroskop with 20X eyepieces and the zoom objective. To help scan across the plate systematically, it helps to place the plate inside a plate lid with parallel black lines drawn every 2.5 mm. I scan across the plate with the zoom set at ∼16X, and usually zoom up all the way to stage eggs when I find them.
I use a multiple channel mechanical counter to keep track of the following categories:
1 cell embryos
2 cell embryos
3-4 cell embryos
5-8 cell embryos
9 or more cell embryos
N2 lays more than 99% embryos at the 9 cell or later stage.
I always repeat the assay on two different days for each strain. I don't understand why, but sometimes the results can vary as much as two-fold! Usually, the standard deviation is more like 20%. The bottom line is that you're only getting a ballpark figure from a single assay.
Results from this assay are only meaningful if you show that your strain undergoes embryonic development at about the same rate as does N2. Pick a few early 1 or 2 cell embryos and follow the timing of their first few cell divisions, and the time it takes to undergo morphogenesis and to hatch. Make sure these times are similar to what you measure for N2.
Contributed by Niels Ringstad and Bob Horvitz, MIT, Cambridge, MA, USA, March, 2005.
The day before, spot fresh plates and incubate overnight at 37°C in a covered container. Assay plates without bacterial lawns should be handled the same way and also left overnight at 37°C. Pick late L4 animals 24 hours before the assay and leave at 20°C.
The next day, bring worms and assay plates to room temperature 2-3 hours before the assay. Assay plates without bacteria are ringed with 4M fructose to prevent animals from crawling off into the void (see Mod assay protocol for details) - do this at least an hour before the assay to allow the fructose ring some time to get absorbed by the plate. I pick the worms into S basal medium and then transfer single worms to assay plates with a mouth pipette. Worms are gently blotted with a Kimwipe and then left for a period of time, usually 60 minutes. After the assay is over, the animal is picked off of the plate and I count the eggs present on the plate. By noting the time of transfer and continuously transferring animals, one can score 30+ animals per hour.
Animals can be assayed in the well-fed state or in a food-deprived state as with the locomotion assays.
Contributed by James J. Moresco and Michael R. Koelle, Yale University, New Haven, CT, USA, March, 2005.
This assay can be used to determine if various compounds can stimulate egg-laying in liquid (Weinshenker et al., 1995). M9 buffer inhibits the egg-laying behavior of wild-type animals. Serotonin and other drugs can overcome this inhibition to stimulate egg-laying in M9 buffer. This assay was originally used to determine if egg-laying defective (Egl) animals had neuronal, vulval or muscle defects. (Trent et al., 1983) Egl animals with vulval muscle defects will not lay eggs when exposed to serotonin. If the muscles of an Egl animal could be induced to contract to release eggs when exposed to exogenous serotonin then the Egl animal was thought to have functioning muscles but defective HSN neurons that did not release serotonin.
Treating animals with drugs to block serotonin removal from the synapse, such as fluoxetine, can potentiate serotonin signaling to stimulate egg-laying. Mutant animals that do not lay eggs when exposed to fluoxetine are thought to have HSN neurons defective in serotonin release.
Imipramine was originally used potentiate serotonin, signaling but fluoxetine has since been shown to be a more selective serotonin reuptake inhibitor (SSRI) and should be used instead of imipramine (Weinshenker et al., 1995).
Culture animals on standard NGM plates seeded with OP50 bacteria at 20°C.
One day prior to the assay, pick 30 late L4 animals from an unstarved plate to a new plate. Under a dissecting scope, late L4 hermaphrodites have a dark spot in the clear crescent formed by the developing vulva. Grow the selected animals at 20°C for 24±1 hours, so they are precisely staged young adults.
Compounds to be tested are dissolved in M9 buffer. As serotonin is not very stable in solution, prepare the serotonin solution the day of the assay. We use 35 mM serotonin in M9 buffer. Serotonin is available in multiple forms. Serotonin hydrochloride (Sigma product number H 9523) is more soluble then serotonin creatinine sulphate complex (Sigma product number H7752) but also nearly ten times as expensive. To dissolve creatinine sulphate complex in M9 buffer heat to 80°C for 5 minutes, cool to room temperature before using. Fluoxetine (Sigma product number F 132) is assayed at 1 mg/ml.
Distribute 50 μl of each test solution into 10 wells of a microtiter dish. For negative controls distribute 50 μl of M9 to an additional 10 wells.
Pick one young adult to each well. Leave the plate at room temperature during the assay.
After 60 minutes the number of eggs laid by each animal is counted.
Data can be presented as the mean eggs laid per animal.
N2 animals laid and average of 13 eggs in serotonin compared to very few in M9 (Desai and Horvitz, 1989).
N2 animals in 1 mg/ml of fluoxetine laid 7.94±1.16 eggs (Weinshenker et al., 1995).
Alternatively data can be presented by binning animals into four categories based on the number of eggs laid, >7 eggs, 4-7 eggs, 1-3 eggs or zero eggs (Trent et al., 1983).
Contributed by Tim Geary, Pfizer, Kalamazoo, MI, USA, March, 2005.
The goal was to identify an assay suitable for measuring egg-laying in a 96-well format, avoiding the necessity for visual inspection of multiple cultures. This technique was published in Ellerbrock et al. (2004).
Based on work done in some species of parasitic nematodes, it appeared that the rate of release of chitinase into culture medium could be used as a measure of egg hatching. We confirmed that chitinase accumulation in medium is directly correlated with egg hatching in C. elegans by experiments involving wt and a couple of Egl strains. The cultures do not have to be synchronous for the method to work.
Wells of a flat-bottomed 96-well plate received a total of 200 ul medium, including 167 ul culture medium (M9 buffer + E. coli broth + 6 ul DMSO +/− drug as appropriate) and 33 ul worm suspension (50–90 worms in M9 buffer). Chitinase activity was measured after a significant proportion of the worms were gravid and L1 larvae were apparent (this is not time-dependent to any degree; the enzyme activity is very stable in the culture supernatants).
To measure enzyme activity, 10 ul of a 0.8 mM solution of chitinase substrate (4-methylumbelliferyl-beta-D-N,N′N″-triacetylchitotrioside, Sigma Chemical Co.) is added to each well. Plates are incubated at 37 C for 1 hr. The reaction is terminated by addition of 100 ul alkaline buffer (1 M glycine/1 N NaOH, pH 10.6). Fluorescence is determined on a 96-well fluorimeter at excitation 360/40, emission 460/40.
Contributed by Bill Schafer, University of California, San Diego, La Jolla, CA, USA.
Egg-laying behavior provides an important phenotypic assay for genetic analysis of nervous system function. In particular, egg-laying is a useful behavioral readout for the activity of the Go/Gq signaling network in neurons and muscle cells, and for neuromodulation by serotonin, acetylcholine, and neuropeptides. The most common assays for egg-laying phenotypes count the number of eggs retained in the uterus, an indirect measure of overall egg-laying rate,. More detailed assays of the temporal pattern of egg-laying can in principle make it possible to distinguish effects on different egg-laying signal transduction pathways. In the presence of abundant food, wild-type animals lay eggs in a specific temporal pattern: egg-laying events tend to be clustered in short bursts, or active phases, which are separated by longer inactive phases during which eggs are retained. This egg-laying pattern can be accurately modeled as a three-parameter probabilistic process, in which animals fluctuate between discrete inactive, active, and egg-laying states. Mutations affecting different cellular or molecular components of the egg-laying circuitry have different effects on this pattern. However, because egg-laying events are infrequent, direct monitoring of the temporal dynamics of egg-laying requires the use of long-term video recording and analysis.
The essential piece of equipment is a microscope equipped for video recording of worms at approximately 50 X magnification (i.e. high enough to easily see eggs on a video image). Some mechanism for recording video (e.g., a VCR) is also required. Most applications of this technique have also utilized a motorized stage controlled by an automated tracking system that allows the worm to be continuously maintained in the field of view during a long recording. Several systems appropriate to this purpose have been described. In the absence of such a tracking system, it is in principle to manually maintain the animals within the field of view throughout the recording, though the required durations of these recordings would make this a tedious task.
Assay conditions and growth media: Unless otherwise noted, nematodes are grown and assayed at room temperature on standard nematode growth medium (NGM) seeded with E. coli strain OP50 as a food source. Typically first-day adult hermaphrodites (obtained by picking L4 hermaphrodites the previous day) are used. Drugs (e.g., serotonin or levamisole) can be added directly to the agar before pouring.
Recording and analysis of C. elegans egg-laying behavior: Single animals are observed as they crawled across a standard 8 cm agar plate using a stereoscopic dissecting microscope equipped with a computer-controlled motorized stage. A video camera records the animal's behavior at standard video frame rate, and a time stamp is used to indicate the time of egg-laying events on the resulting videotape. For the tracking systems commonly used for these analyses, egg-laying times are determined by manually replaying the videotapes. An egg-laying event is defined as a muscle contraction that leads to the expulsion of one or more eggs. An automated algorithm for egg-detection has been described (Geng et al., 2005), though it has not been extensively used for actual behavioral analysis.
ML estimates of model parameters from real data. For wild-type N2 and most N2-derived mutant strains, egg-laying occurs in short bursts, or active phases. The onset of the active phase can be modeled as an exponential random variable with a time constant on the order of 20-30 minutes, while egg-laying events within the active phase model as an exponential random variable with a time constant of around 20 seconds.
For egg-laying events that conform to this pattern, we can prove that the random variable governing the egg-laying interval times has the following probability density function (p. d. f.) (Zhou et al., 1998):
One way these parameters can be estimated for a given set of data is using the maximum likelihood method. This involves maximizing the likelihood function for the above probability density function for the observed interval data. Given N observations of the intervals x = [x1,x2, …, xN], the likelihood function is given by:
which is a function of the parameter vector θ = [p, λ1, λ2]. The maximum likelihood 'estimate' is defined as the θ that maximizes f(x|θ) over all possible θ's. The bi-modal peak information provided by the histogram of the log intervals was used to obtain a rough estimate of θ and initialize the non-linear ML algorithm, which adjusted the parameters to maximize the likelihood function.
For some cases (e.g., N2 animals on serotonin, some Egl-c mutants, some non-N2 nematode strains) a pattern resembling a homogeneous Poisson process is observed. The time constant for egg-laying in these cases can be estimated by performing a weighted least-squares linear regression to the log tail distribution (see below).
Log tail distribution: One useful method for assessing the temporal pattern of egg-laying is the log tail distribution. It can be shown that the log tail probability (i.e., the log of the probability that a given interval will be longer than time x) for intervals generated by animals fluctuating between active and inactive egg-laying states is given by:
When the interval duration t is plotted against the log of the frequency of intervals greater than t, a biphasic plot will be obtained. For the long intervals (x >5/λ1), ln Pr(X≥x) becomes approximately linear with respect to x, with slope -pλ2. Thus, the slope of this plot is inversely proportional to the average duration of the inactive phase. If the pattern follows a single exponential distribution, the log tail distribution will be linear with a negative slope equal to the time constant for egg-laying.
Histogram of log intervals: Another way to visualize the overall distribution is with a histogram of interval times. Since the intervals between eggs laid are clustered at short intervals and sparse at long intervals, it is more meaningful for reasons of better dynamic range to study the distribution of the log intervals (denoted by Y = ln X). Animals showing an N2-like clustered pattern exhibit a bimodal distribution, which can be shown to be represented by the following p. d. f. of Y:
We can show that when λ1 and p λ2 are sufficiently different, fY(y) peaks at y = ln(1/λ1) and ln(1/pλ2) with corresponding peak heights k1/e and k2/e. When the values of λ1 and pλ2 are close (or when egg-laying events are unclustered), only a single peak is observed.
Advantages: One significant advantage of this type of analysis is the ability to more precisely classify the phenotypes of egg-laying defective mutants. Some mutants with slow egg-laying rates (e.g., mutants defective in HSN function) show a lengthened time constant for the long interburst intervals but normal or even a shorter time constant for the short, intraburst intervals. In contrast, other mutants (e.g., mutants affecting muscle calcium channels) exhibit an unclustered, or less clustered, egg-laying pattern. A second advantage is a greater sensitivity in detecting subtle egg-laying phenotypes. For example, mutants defective in vulval muscle nicotinic acetylcholine receptors show increased time constants for the short intraburst intervals, even though they are not visibly Egl. Finally, this method has the advantage of being a direct measure of egg-laying behavior. Unless the uterus is depleted of eggs, it does not appear that the number of eggs in the uterus significantly alters the probability of an egg-laying event; thus, as long as a mutant retains nearly normal numbers of eggs there is less concern that effects on the rate of egg-production will confound the scoring of an egg-laying phenotype.
Disadvantages: As noted above, mutants that do not retain many eggs are difficult to analyze with this method. Practically, the analysis of video recordings is relatively time- and labor-intensive. To obtain reliable timing parameters, it is usually necessary analyze at least 100 intervals between egg-laying events, a number that generally requires analysis of at least 30 hours of recording. Thus, phenotyping methods based on evaluating the number or developmental stage of eggs retained in the uterus are far more effective assays for identifying egg-laying defective mutants in screens.
See also “Leaving food by males, not hermaphrodites” in Chemosensation section.
Contributed by Curtis Loer, University of San Diego, San Diego, CA, USA, March, 2005.
Ideally, all these behaviors are scored blindly (Loer and Kenyon, 1993).
Pick L4 males to seeded plate, score the next day (Some loss may occur from male “leaving”).
Adult males picked with minimal bacteria and released by swishing into 2 ml M9 (+/− drugs) in 24-well plate. Typically scored with about 10-20 males/well.
After 15–20 minutes, observe each male with stereomicroscope for 10 sec. Males with the tail tightly curled ventrally for ≥ 5 sec are scored as “curled.” At higher drug concentrations, some worms will be paralyzed in this position.
Pick L4 males to seeded plate, score the next day (Some loss may occur from male “leaving”).
Place four young adult unc-51 hermaphrodites as partners scattered about the mating spot lawn away from the edge.
Individual adult males are picked and placed in the spot as gently as possible. At least 5 min recovery is allowed prior to observations.
Observe each male worm for 5 min, beginning when the male's tail first contacts a hermaphrodite. One can gently shuffle plates under the stereoscope until finding a male very near or in contact with a hermaphrodite. Plates are closed when observed.
Turns are scored as good, sloppy, missed. Each male is scored for the percentage of each type of turn. See definitions below.
A “good” turn occurs when the male tail remains in contact with the hermaphrodite throughout the turn and continues backing on her opposite side after the turn is completed. A “sloppy” turn occurs when the male's tail temporarily loses contact, but regains contact on the opposite side quickly because of a favorable trajectory (weak or late curling occurred, but was sufficient). A “missed” turn occurs when the male's tail sails off the end of the hermaphrodite, completely losing contact. This can occur either because the tail curl is not as tight or because the tail curl is late. With missed turns, the male often moves off away from the hermaphrodite and only resumes “turning” upon contact with this or another hermaphrodite in the mating spot (See Figure 4 of Loer and Kenyon, 1993).
Adapted from the literature (Waggoner et al., 2000): Acute egg-laying response to levamisole can be measured after 1 hr in M9 plus levamisole. This response can be suppressed by pre-adaptation to nicotine. Animals are placed on 30 mM nicotine seeded NGM plates for varying lengths of time, then tested for response to levamisole in individual liquid M9 assays. To maximize the possibility that a levamisole-sensitive animal would lay eggs, eggs were counted after 4 hr in levamisole in these assays.
The follow section on reproductive behaviors was compiled and contributed by Scott Emmons, Albert Einstein College of Medicine, Bronx, NY, USA, May, 2005.
As may be expected for a self-fertile hermaphrodite, C. elegans hermaphrodites resist mating by males, especially when they are young and have self-sperm. Males find it impossible to insert their spicules into some individual hermaphrodites (Liu and Sternberg, 1995). Two behaviors have been defined associated with mating resistance, sprinting and sperm expulsion, (Barker, 1994a; Barker, 1994b; Kleemann, 2005). In sprinting, hermaphrodites move forward quickly when touched by a male. After a male ejaculates into the uterus and swims away, contractions of the uterus may cause the seminal fluid to be expelled out through the vulva.
Contributed by G. Kleemann and Scott Emmons, Albert Einstein College of Medicine, Bronx, NY, USA, May, 2005.
Plastic Petri plates (6-cm-diameter), NGM agar medium, Escherichia coli strain OP50 and compound microscope with moveable stage, video camera, and monitor.
The day before, put 5 μl of bacteria from an overnight culture of E. coli strain OP50 in the center of each plate, creating a 5 mm circle of bacteria. Leave the plates on the bench overnight. Move individual larval (L4 stage) worms to separate plates about 12 hours prior to the assay. At the beginning of the experiment, place a single hermaphrodite and a single male on opposite sides of a bacterial patch. Put the whole Petri dish on the microscope stage. Trials can be videotaped through the 5X objective of a compound microscope. The male is kept in the field of view using the moveable stage, and the behaviors of the worms are videotaped for later analysis.
Hermaphrodite sprinting is defined as a visually distinct increase in the velocity of hermaphrodite swimming (at least 2 seconds in duration) while the male is in contact but prior to sperm transfer.
Contributed by G. Kleemann and Scott Emmons, Albert Einstein College of Medicine, Bronx, NY, USA, May, 2005.
The setup is the same as for the Sprinting assay above. Video tape the activities of the worms for one hour or 15 minutes after successful sperm transfer. Fifteen minutes is sufficient to allow sperm to migrate beyond the opening of the vulva making sperm ejection unlikely. After sperm transfer is observed, keep the hermaphrodite vulva in the field of view for 15 minutes. The male ejaculate will displace eggs in the hermaphrodite uterus and can be seen through the body wall as an area filled with clear fluid. Individual sperm cells may be visible as small round cells. Score sperm ejection when fluid is expelled from the vulva. Often a singly mated hermaphrodite ejects sperm multiple times, therefore the number of sperm ejection bouts can also be recorded.
Compiled and contributed by Scott Emmons, Albert Einstein College of Medicine, Bronx, NY, USA, May, 2005.
An isolated male on a restricted food source on an agar plate eventually leaves the food and wanders about the agar surface. This is a sex-specific and age-specific behavior not expressed by adult hermaphrodites or juveniles of either sex. Moreover, males do not leave a food source if hermaphrodites are present (providing a means for assaying male detection and response to hermaphrodites, see below). Since wandering behavior is not expressed in the presence of hermaphrodites, it appears to be a mate-searching behavior. Mate-searching is assayed by measuring the rate at which isolated males leave a food spot in the Leaving Assay (Adapted with permission from Lipton et al., 2004, Copyright 2004 by the Society for Neuroscience). Mutant males that do not leave food are said to have a Las phenotype (leaving assay defective).
Adapted with permission from Lipton et al. (2004). Contributed by Scott Emmons, Albert Einstein College of Medicine, Bronx, NY, USA, May, 2005.
Plastic Petri plates (9-cm-diameter) agar medium [17 gm of agar (Difco, Detroit, MI), 2.7 gm of Bactopeptone (Difco), 0.55 gm of Tris base (Sigma, St. Louis, MO), 0.27 gm of Tris HCl (Sigma), 2.0 gm of NaCl (Fisher Scientific, Pittsburgh, PA), and 1 ml of ethanol containing 5 mg/ml cholesterol (Sigma), per liter H2O] Escherichia coli strain OP50 (OD=1.0).
Prepare plastic Petri plates with 10 ml agar medium and allow plates to dry (lids closed) overnight on a laboratory bench. A smaller amount of agar per plate is used (10 ml) compared with the standard amount for genetics (23 ml) because it increases the ease of scoring worm tracks on the agar surface.
Inoculate each plate in the center with 18 μl of E. coli strain OP50 grown to OD600 = 1.0 and allow plates to incubate for 12-16 hr at room temperature to establish a small circular lawn of approximately 9 mm diameter. The dryness of the agar surface and degree of bacterial growth are the most critical variables for reproducible results.
Select approximately 20 L4 larval worms from worm cultures and hold on same-sex seeded plates for 12 hr to mature.
To start the assay, place around 20 single males individually on the bacterial lawns of assay plates. Keep the plates at room temperature and examine them at intervals to determine if the male is a leaver or non-leaver. An animal is scored as a leaver if it is present outside a 3.5 cm radius circle (1 cm from the edge of the plate) or if its track shows that it passed beyond this circle during the preceding time interval. Tracks can often be most easily seen by observing the plate tilted at angles to observe the reflections of laboratory lights on the agar surface.
Leaving rate is calculated as the probability of leaving per hour, PL. Plots of log (fraction non-leavers) versus time yield, during the first 24 hours, straight lines passing through the point representing 100% non-leavers at time 0. Such linear plots reflect the constant probability per unit time that a male will leave. PL is estimated as the hazard obtained by fitting an exponential parametric survival model to the censored data using maximum likelihood (software R; http://www.R-project.org). Under normal conditions, wild type males leave with a PL value of around 0.17-about half the males will have left in the first 5 hours of the assay. To control for fluctuations in conditions, the leaving rate of experimental animals should be compared to that of wild type controls tested side-by-side on the same batch of plates.
Contributed by Scott Emmons, Albert Einstein College of Medicine, Bronx, NY, USA, May, 2005.
Males can detect hermaphrodites and chemical substances (pheromones) produced by hermaphrodites. This ability can be assayed using a variation of the Leaving assay described above (Lipton et al., 2004) or by observing male behavior on agar conditioned by hermaphrodites (Simon and Sternberg, 2002). These assays may reveal responses to multiple signals, including non-sexual chemical cues, for example those involved in social interactions (de Bono and Bargmann, 1998), as well as sex pheromones.
Adapted with permission from Lipton et al. (2004), Copyright 2004 by the Society for Neuroscience. Contributed by Scott Emmons, Albert Einstein College of Medicine, Bronx, NY, USA, May, 2005.
From Simon and Sternberg (2002), contributed by Scott Emmons, Albert Einstein College of Medicine, Bronx, NY, USA, May, 2005.
5-cm diameter agar plates, OP50 and video system attached to the dissecting microscope.
Prepare the plates: three drops of OP50-inoculated LB, spread thinly, with a ∼0.25-centimeter gap between the edge of the lawns and the walls of the plates. Plates were stored at ∼22°C for 2 days until used for trials.
Harvest source and test animals at the fourth larval stage (L4), and store at ∼18°C overnight with 10-20 animals per same-sex plate to be used the following day in trials as young adults.
Condition agar plates for at least 3 and up to 8 hours with 10-20 source animals (paralyzed muscle mutant unc-52). Spread out the source animals along a 1 cm line (see Simon and Sternberg, 2002). Remove the source animals 5 to 10 min before the onset of a trial.
Introduce a single test animal on a single trial plate, 1 cm from the conditioned scoring region, orienting it in the direction of the scoring region. Document (videotape) its movement for 5 min.
Score and record the number of reversals made when the male crosses the conditioned region and the time animals spend in the conditioned region. Backwards movement equal to or greater than a body length was counted as “1 reversal”; backward movement less than a body length was counted as “0.5 reversal.”
The frequency of reversals is used as an indication that males detect a cue.
Equal numbers of unconditioned and conditioned agar trials are run in parallel on ∼5 plates each per day. Trials are run blindly and interspersed at random. Unconditioned agar trials are meant to parallel conditioned agar trials as closely as possible: (i) made from same day bacterial lawns, (ii) kept at the same temperature, and (iii) have bacteria picked on and off to mimic introduction of source animals as on conditioned agar trials.
Contributed by A. Barrios and Scott Emmons, Albert Einstein College of Medicine, Bronx, NY, USA, May, 2005.
3.5-cm diameter agar plates, OP50, digital video camera attached to the dissecting microscope and M9 buffer.
Prepare the plates: seed the plates the day before, spreading the OP50 thinly over the entire agar surface.
Harvest test L4 males the day before and keep at 20°C overnight.
Incubate 40 him-5 or N2 adult hermaphrodites in 40 μl of M9 buffer for 4hrs before the assay, room temperature.
Place 2 μl of M9 buffer (control spot) and 2 μl of hermaphrodite-conditioned M9 buffer (conditioned spot) 1.5 cm distance away from each other on the centre of the plate. Wait until the spots are dry before starting the trial.
Place 10 to 12 males equidistant from the two spots near the edge of the plate (about 1.5 cm from each spot) and record their locomotion for 20 min. After approximately 15 min, one can observe accumulation of worms in the conditioned spot. For each worm that enters a spot (conditioned and control), score the time it spends in the spot before exiting it again (time leaving spot - time entering spot). Calculate the ratio of average time on conditioned spot to average time on control spot. Typical values for wild type worms are 148 sec ± 14 sec (s.e.m.) (conditioned), 47 sec ± 7 sec (s.e.m.) (unconditioned); conditioned/unconditioned = 3.1.
Compiled and contributed by Scott Emmons, Albert Einstein College of Medicine, Bronx, NY, USA, May, 2005.
The Holding Assay (Simon and Sternberg, 2002) is identical to the Response to Pheromone Assay, Variation 1, with the following modifications:
Source animals are introduced in a pile in the center of a plate, rather than along a 1 cm line.
After removal of the source animals, test animals are introduced directly on this conditioned spot, rather than 1 cm away from it.
In addition to the center circle, number of reversals is scored in outwardly stacked, concentric ring-areas (with radii of 1 mm, 5 mm, 16.5 mm, and 25 mm; unequal sized areas are normalized by dividing outer ring-areas by 24, 247, and 330, respectively).
Movements of test animals are documented for 10 min and compared in each area. A difference between scores on conditioned and unconditioned plates indicates the male's behavior is modified persistently and not just on first encounter of a signal. Moreover, the alteration in male behavior results in his remaining close to the hermaphrodite.
Compiled and contributed by Scott Emmons, Albert Einstein College of Medicine, Bronx, NY, USA, May, 2005.
(Similar to the Tendency to Mate Assay below.)
The Attraction Assay (Simon and Sternberg, 2002) is similar to the Holding Assay with the following modifications:
Source animals are left to condition a point source for 24h.
At the onset of each trial, a single hermaphrodite is placed on top of conditioned region.
Test males are introduced 1.5 cm from the conditioned point source/unconditioned scoring region.
Determine the time it takes for the male to find the hermaphrodite. This assay can be used to show that the male finds the hermaphrodite more quickly on conditioned than on unconditioned medium. In other words, the modification in male behavior consequent on detecting a signal has the result of more rapid mate finding.
Compiled and contributed by Scott Emmons, Albert Einstein College of Medicine, Bronx, NY, USA, May, 2005.
Male copulatory behavior can be broken down into a series of sub-behaviors (Barr and Sternberg, 1999; Emmons and Sternberg, 1997; Liu and Sternberg, 1995; Loer and Kenyon, 1993). Assays for each of the main subdivisions of the behavioral series are given below. These subdivisions may themselves be composed of further definable sub-steps. In addition to copulation itself, the time it takes for a male to begin copulation when in the presence of hermaphrodites (Tendency to Mate) can be determined.
Compiled and contributed by Scott Emmons, Albert Einstein College of Medicine, Bronx, NY, USA, May, 2005.
This assay really measures male fertility rather than behavior. It gives an overall indication of mating ability if the gonad and morphology of the male are normal. It has been traditionally used to score the mating ability of mutant males (Hodgkin, 1983) and is useful for determining whether a particular genotype may be used as the male in a genetic cross (Hodgkin et al., 1988).
Prepare cross plates: spread ∼20 μl OP50 on standard 5 cm diameter agar plate to make a 1 cm bacteria lawn and store 2 days before use.
Place 6 test males and 6 Unc or Dpy hermaphrodites at late L4 stage together on the bacterial lawn of a cross plate.
Remove males after 24 hour at 20°C.
Transfer hermaphrodites to fresh regular agar plates each day for 4-5 days until they lay no eggs.
Count cross progeny (nonUnc or nonDpy) and self progeny (Unc or Dpy) each day.
Total cross progeny is divided by total progeny (cross plus self progeny) and the percentage is used as an indication of male mating efficiency (ME): ME0 = never mating; ME1 = almost never mating (less than 1% of wild type); ME2 = poor mating (1-10% of wild type); ME3 = fair-to-excellent mating (10-100% of wild type).
(Similar to the Attraction assay above and the Response assay below.)
Contributed by L. Jia and Scott Emmons, Albert Einstein College of Medicine, Bronx, NY, USA, May, 2005.
Standard 5-cm diameter agar plates, OP50 and dissecting microscope (with attached video system, optional).
Prepare mating plates: a small drop (18μl) of OP-50 bacteria spread on the center of a standard 5 cm diameter agar plate; dry the plates on the laboratory bench overnight to make a ∼ cm diameter bacterial lawn.
Isolate both hermaphrodites and males at the L4 stage and keep in isolation until used the following day in all observations as healthy young adults.
To begin the assay, place 4 unc-51 hermaphrodites on one edge of the bacterial lawn and a single tester male on the other side of the bacterial lawn.
Observe or document the male's movement for 10 min under a dissecting microscope.
Determine the interval from the start of the assay to the time when the male presses the ventral side of his tail against the surface of a hermaphrodite in the Response step of copulation (see below). Plot a histogram (typically 20 males) of the number that respond in less than 5 min, 5-10 min, >10 min (i.e. do not respond during the 10 min assay). Typically for wild type males, 90% will give a Response behavior (stop forward locomotion, place ventral side of fan against hermaphrodite, back up) in the first 5 min, whereas the most severely deficient mutants ignore the hermaphrodites altogether and never give a response within 10 min.
By K. Knobel and M. Barr, a variation of Liu and Sternberg (1995) and Barr and Sternberg (1999) (Lov phenotype), contributed by Scott Emmons, Albert Einstein College of Medicine, Bronx, NY, USA, May, 2005.
Response is a complex behavior. It begins when a male touches a hermaphrodite with his tail and stops his forward locomotion. He next assumes a specific posture in which the posterior body curves slightly ventrally and the fan is pressed against the side of the hermaphrodite. He then begins to back up by propagating anteriorly-moving waves through the anterior part of the body, while maintaining the posterior body pressed against the hermaphrodite. All of these steps must be achieved to score a positive response.
Strains: unc-31 (e169) hermaphrodites and mating controls such as CB1490 him-5 (e1490) (wild type control) and PT9 (pkd-2 (sy606); him-5 (e1490) (Lov mutant).
NGM plates, laboratory timer, liquid OP-50 culture, and dissecting microscope.
Day before mating assays: Set up worms to use for mating: Select L4 males from plate of the strains to be charac-terized and place them on a pre-seeded plate. Make sure there are no hermaphrodites on the plate. Put worms at 15°C (20°C) overnight.
Procedure 14. Mating day
Carefully drop 10 μl of concentrated OP-50 into the center of a worm plate. (Spin down 2 tubes of 1.5 ml ea OP-50 culture and resuspend both pellets in a total of about 100–150 μl.) Let plates dry at room temp (keep tops off until dry, around 30 minutes, ok at room temp or 15°C overnight).
Take worms out of 15°C incubator and let warm up to room temp (about 30 minutes).
Place 12-20 adult unc-31 hermaphrodites onto the lawn of a mating plate.
Place 2-3 males of each strain onto the mating plate with the hermaphrodites and start the timer.
Observe each worm and score male behavior with respect to time for 4 minutes in the following categories:
Touch (o): touch (note at what time this occurs) (x)-touch but no r.
Response (r): male wraps fan around hermaphrodite like a suction cup and initiates backing.
Back (b): male backs along length of hermaphrodite body.
Forward (f): male moves forward along length of hermaphrodite body.
Turn (t): male turns around head or tail of hermaphrodite (note: t10= turn at 10% of herm body where 0 is head and 100 is tail tip) and t90 =turn at 90% of herm body-Also note if turning occurs at other locations).
Locate (l) (stopping for greater than 1 sec) or pass (p) or hesitate (h) (pause for less than 1 sec) at the hermaphrodite vulva (note time).
Off (…): worm leaves hermaphrodite momentarily and returns.: male leaves the hermaphrodite.
For example: wild-type (him-5 (e1490) might look like: r/b/t/l (r= 1, l= 1/1 or 100%) or r/b/t/h/b/f/l (r=1, l= 1/2 or 50%) lov-1 mutants: x/x/r/./r/./r/b/t/p/t/b/t/p/t/b/t/l (r=1, L=1/3 or 30%).
After trial is over remove the males and start over with 2 more males. Collect data from at least 10-20 worms during 3-4 trials on different days.
Data analysis %Response: (# responding within 4 minutes/total # worms evaluated) x100.
%Vulva location: (# l /(# l+# p+# h) x100.
By E. Peden and M. Barr (Peden and Barr, 2005), contributed by Scott Emmons, Albert Einstein College of Medicine, Bronx, NY, USA, May, 2005.
Day before assay: segregate >50 L4 males O/N.
Day of assay: Prepare mating plates with 50-70 young adult hermaphrodites on a patch of bacteria made from a 10-12 microliter OP50 drop (see Response and Vulva Location Assay for making mating plates).
Add 5 adult males to the hermaphrodite-rich mating plate.
Score # males that respond to a hermaphrodite in 3 minutes (a single male may only be counted once).
Response is defined when the male stops at hermaphrodite and places ventral tail on a potential mate for > 20 consecutive seconds).
Response Efficiency (RE) = [# males responding / (5 males)] X 100% (e.g., if 4 males respond, RE = 4/5 = 80%).
Run at least 5 trials per strain per day (=25 males) for at least 3 different days (at least 75 males total); compare at least 3 different strains per day.
By E. Peden and M. Barr, contributed by Scott Emmons, Albert Einstein College of Medicine, Bronx, NY, USA, May, 2005.
Day before assay, segregate >50 L4 males O/N.
Day of Assay: Prepare mating plates with ∼ 25 unc-31 hermaphrodites.
Add and observe 1 male at a time. Score behavior as for Response and Vulva location assay.
Count the number of passes or hesitations (encounters) at the vulva until the male FIRST stops at vulva.
Stop trial after male first stops at the vulva.
Location Efficiency (L.E.) = 1 / # encounters to stop (e.g., if male stops at vulva on first encounter, then LE = 1/1; if male stops at vulva on third encounter, then LE=1/3).
By T. Liu and M. Barr, contributed by Scott Emmons, Albert Einstein College of Medicine, Bronx, NY, USA, May, 2005.
Turning is a complex behavior expressed during the response phase of copulation when the male encounters either end of the hermaphrodite. Males first must detect the end (often they detect its approach before they actually reach it, at about 10% or 90% of body length). Detecting the end stops backing and triggers a deep ventral bend or arch of the posterior body region so that the fan slides around to the other side of the hermaphrodite. Next, the deep ventral bend or arch is propagated along the body to the head, while the posterior body region is held in the posture typical of backing and the fan slides along the body. When the entire body is around the hermaphrodite, normal backing is resumed.
See also Loer and Kenyon (1993), who scored turns into three categories: “good,” “sloppy,” and “missed.”
Step 1
Wild type turning: stops backing as his tail reaches the end of hermaphrodite.
Defective phenotype: (A) continues backing though the tail has passed the end of hermaphrodite.
Phenotypic categorizations and representative mutants: “swim-off”, example: males lacking rays 7-9, males having reduced or absent dopamine/serotonin synthesis (cat-1, cat-2, bas-1).
Step 2
Wild type turning: makes a sharp ventral bend in the tail (i.e. the tail is pressed against hermaphrodite all the time) and turns to the other side of hermaphrodite.
Defective phenotype: (B) makes a wide turn (i.e. at some point, the tail loses contact with hermaphrodite completely).
Phenotypic categorizations and representative mutants: “wide turn”, example: cat-1, cat-2(C) halts right before/after turning, then moves forward along hermaphrodite for a distance (ranges from 1/10–2/3 of hermaphrodite body length) and repeats backing.
Phenotypic categorizations and representative mutants: “stutter turning”, example: egl-3.
Step 3
Wild type turning: slides fan along body and propagates the deep ventral bend or arch along the body to the head, then continues backing along the other side of hermaphrodite.
Defective phenotype: (D) the fan does not slide but stops on the other side of hermaphrodite immediately after it turns around, the rest of the male body begins arching until the male head reaches the hermaphrodite end, then the tail continues to lead backing.
Phenotypic categorizations and representative mutants:, example: cat-1.
Mating assay plates: inoculate 5cm NGM plates with 10ul OP50 (OD=1.0) and leave them on bench for 24 hours. Then they are ready for immediate use or can be sealed and kept at 4°C for up to 1 month.
Male subjects: isolate 30-40 L4 males 12-20 hours prior to behavioral observation and keep them at 20°C until use.
Hermaphrodite subjects: on the day of observation, pick 20 unc-31 adult hermaphrodites to the mating plate.
Procedure 15. Behavioral observation
Pick one male to mating plate each time.
If the strain is wild type in response, do a 5-minute observation, otherwise, do a 10-minute observation.
For each male observed, take notes for all the turns he makes during the entire observation time, i.e. wild type, swim-off, wide turn, or stutter turn (use m/n expression for stutter turn: m = how many times the male actually turns his tail to the other side of hermaphrodite (usually 1 or zero); n = how many times the male repeats the forward-backward motion for this single turn).
Transform first-hand notes into statistically manageable data: for each male subject observed, give a numerical value “1” if a defective turning is recorded and “0” if none.
Contributed by R. Garcia and Scott Emmons, Albert Einstein College of Medicine, Bronx, NY, USA, May, 2005.
Spicule insertion is probably the most difficult step of mating behavior for the male to accomplish. This behavioral step consists of two motor behaviors: the spicules prodding the vulval slit rhythmically, and the spicules penetrating the vulva. Both of these behaviors require high magnification and cooperative hermaphrodites for consistent measurement.
Standard 5-cm diameter agar plates
M9 buffer
Aerated overnight culture of OP50
unc-52 (e444) or unc-38 (sy576);egl-19 (n582) unc-31 (e169) or unc-64 (e246).
Stereomicroscope with at least 300X total magnification with attached video and recording system or Compound microscope with a long working distance 40X objective with attached video and recording system.
Microscope slides.
Prepare plates: spread ∼ 40μl OP50 on standard 5 cm diameter agar plates to make a 2 cm bacterial lawn; store 2 days before use.
Place 5 to 20 late L4 males together on the bacterial lawn. (Do not place more than 20 males together because they will aggregate and burrow into the agar. Placing less than 5 males may cause the males to leave the bacteria and desiccate on the side of the Petri plate.) Incubate at 20°C for 24 hours.
Spin down 1 ml of a fresh aerated overnight culture of OP50. Remove the media and resuspend the pellet in 100 ml of M9 buffer.
Add 10 ml of cells to 5 cm diameter agar plate. Let the liquid absorb into the agar. The OP50 should be concentrated enough to form an instant lawn.
To observe long runs of spicule prodding behavior, use a severely paralyzed egg-laying defective, > 24 hr adult hermaphrodite; unc-52 (e444) or unc-38 (sy576); egl-19 (n582) double mutants work well. To observe spicule insertion, use a 48 hour paralyzed hermaphrodites such as unc-31 (e169) or unc-64 (e246). Place 5 to 10 hermaphrodites on the lawn; let the hermaphrodites acclimate for 15 minutes before putting the males on the lawn.
Gently put the male on the lawn using a pick or a mouth tube. If using a mouth tube, try not to get too much liquid on the bacterial lawn.
If using a high magnification stereomicroscope, the animals can be immediately observed. If using a compound microscope with a long working distance 40X objective, before adding the male, cut the block of agar containing the bacterial lawn from the plate and put it on a standard microscope slide. Add the male to the bacterial lawn, put the slide on the microscope stage, using the 10X objective to focus on the male; follow the male by adjusting the stage controls. When the male chooses a hermaphrodite, focus on her vulva and switch the objective to 40X. During matings with >24 hr adult unc-52 or unc-38; egl-19 hemaphrodites, the spicules of wild-type males should prod the vulva at frequency of 7 to 9 Hz (video recordings need to be slowed down to count the spicule movements). During matings with 2 day old unc-31 or unc-64 hermaphrodites, the males should insert within a few seconds of vulva contact.
Contributed by R. Garcia and Scott Emmons, Albert Einstein College of Medicine, Bronx, NY, USA, May, 2005.
Normally, a male keeps his copulatory spicules within his tail prior to and between mating events. Certain mutations may disrupt this regulation and cause males to protract their spicules spontaneously in the absence of hermaphrodites. The spicule muscles and neurons are quite sensitive cells and precocious spicule protraction can provide a readout to determine if a mutation can enhance cell excitability.
Standard 5-cm diameter agar plates, OP50 and dissecting microscope.
Prepare plates: spread ∼ 40μl OP50 on standard 5 cm diameter agar plates to make a 2 cm bacteria lawn; store 2 days before use.
Place 5 to 20 late L4 males together on the bacterial lawn. (Do not place more than 20 males together because they will aggregate and burrow into the agar. Placing less than 5 males may cause the males to leave the bacteria and desiccate on the side of the Petri plate.)
After 24 hour at 20°C, count the number of males that have at least one spicule protruding from their cloaca. Generally, anywhere between 0 to 12% and 0 to 5% of virgin him-5 (e1490) and him-8 (e1489) males (that is, wild type or nonPrc), respectively, will have their spicules protracted.
Contributed by Scott Emmons, Albert Einstein College of Medicine, Bronx, NY, USA, May, 2005.
Acetylcholine agonists such as levamisole, arecoline, nicotine and oxotremorine M can cause adult males to protract their spicules. These drugs act on the spicule muscles and some drugs such as oxotremorine M also act on the neurons that innervate them. Each of these drugs stimulate spicule protraction via a different mechanism; thus drug-induced spicule protraction can be used as a readout to determine if a certain mutation may interrupt different types of pre-and post synaptic cholinergic signaling.
Standard 5-cm diameter agar plates, OP50, Pyrex 3 well round bottom dish, Levamisol, arecoline, nicotine and oxotremorine M (Sigma) and dissecting microscope.
Prepare plates: spread ∼ 40μl OP50 on standard 5 cm diameter agar plates to make a 2 cm bacteria lawn; store 2 days before use.
Dissolve the drugs in distilled water. Stock concentrations are.
1mM for levamisole, 10mM for nicotine, 100mM for arecoline and oxotremorine. Drugs can be frozen at −20°C, but should not be repeatedly frozen and thawed more than 3 times. Keep arecoline and oxotremorine M in the dark.
Place 5 to 20 late L4 males together on the bacterial lawn. (Do not place more than 20 males together because they will aggregate and burrow into the agar. Placing less than 5 males may cause the males to leave the bacteria and desiccate on the side of the Petri plate.)
Dilute drugs appropriately in distilled water (do not use M9 buffer, somehow this interferes with drug response, and one must use 10X more drug to get the same response curve). The range of working concentrations for the drugs are: levamisole (100nM to 1mM), nicotine (1mM to 5mM), arecoline (10mM to 10mM). Oxotremorine M (100mM to 50mM).
Add 1 ml of the drug to 1 well of the Pyrex 3 well round bottom dish.
Add 1 to 5 adult males to the drug using a worm pick. Watch the males for 5 minutes, score the male as sensitive if he keeps his spicules protracted ∼ 10 secs.
After one set of males has been scored, the males can be sucked out of the drug using a pipetter, and new males can be added to the drug bath. Change the drug bath after every 3 trials or if the bath gets too dirty with bacteria.
By G. Schindelman and P. Sternberg.
Compiled and contributed by Scott Emmons, Albert Einstein College of Medicine, Bronx, NY, USA, May, 2005.
Standard 5-cm diameter agar plates, OP50, dissecting microscope with good optics, and laboratory timer.
Prepare the plates: OP50 is spotted onto plates to make a 1-2 cm bacterial lawn and plates are stored at ∼22°C for at least 2 days until used for assay. Plates older then 7 days tend to cause aberrant mating behavior.
Males to be tested are picked 18-24 hrs before assay at the L4 stage and moved to fresh plates in groups of 10-20 before observation.
For sperm transfer assays a virgin adult male (18-24 hrs post L4 lethargus) is placed on the 1-2 cm bacterial lawn with multiple unc-31 hermaphrodite adults (approximately 50). The hermaphrodites used are between 3 and 4 days post L4, as these are partners with which spicule insertion occurs almost instantaneously and therefore facilitates the analysis of sperm transfer. It appears to help if the staged hermaphrodites are place on the bacterial lawn 1 to 2 hours before assay. After tonic spicule insertion, a stopwatch is started. Time points can be taken when the sperm are released into the hermaphrodite (release) and when the spicules were retracted after sperm transfer (cessation).
Contributed by James Thomas, University of Washington, Seattle, WA, USA, March, 2005.
Pick one (or a few) young to mid adults to a fresh NG plate seeded with OP50. You can assay larvae and older adults as well, but defecation periodicity may be more variable or harder to see. Males are quite difficult to assay.
The assay plate should be relatively fresh with a lawn of bacteria that isn't too thick or old.
Only assay an animal that is on the lawn and feeding.
Avoid air currents, plate taps, or anything else that might disturb the worm, as these cause the cycle period to be more variable. Temperature should ideally be 20° though most aspects of the assay will be quite similar from about 20° to 25°.
Let the worms settle down for at least 5 minutes. Picking the worms upsets them and they won't feed or defecate normally for a minute or two. To be safe, wait at least 5 minutes.
Observe a single animal closely at about 25X magnification using a high-quality dissecting microscope.
A typical assay goes for about 10 minutes and a DMP occurs every 45 to 50 seconds.
You have to watch continuously to be sure you don't miss anything (though if the assay is with the wild type under standard conditions, you can relax a bit after each DMP since another one is unlikely to happen for the next 30 seconds or so).
C. elegans responds to electrical fields. This response is under active investigation but no protocols have been published.
As C. elegans normally dwell in the soil, their lack of circadian rhythms is not surprising. However, C. elegans homologs of Per, Tim and other proteins involved in circadian rhythms in other species are coordinately expressed with the C. elegans larval molts suggesting possible related function (Banerjee et al., 2005; Jeon et al., 1999).
Arena, J.P., Liu, K.K., Paress, P.S., Frazier, E.G., Cully, D.F., Mrozik, H., and Schaeffer, J.M. (1995). The mechanism of action of avermectins in Caenorhabditis elegans: correlation between activation of glutamate-sensitive chloride current, membrane binding, and biological activity. J. Parasitol. 81, 286–294. Abstract
Aroian, R.V., and Sternberg, P.W. (1991). Multiple functions of let-23, a Caenorhabditis elegans receptor tyrosine kinase gene required for vulval induction. Genetics 128, 251–267.
Baek, J.H., Cosman, P., Feng, Z., Silver, J., and Schafer, W.R. (2002). Using machine vision to analyze and classify Caenorhabditis elegans behavioral phenotypes quantitatively. J. Neurosci. Methods 118, 9–21. Abstract Article
Banerjee, D., Kwok, A., Lin, S.Y., and Slack, F.J. (2005). Developmental timing in C. elegans is regulated by kin-20 and tim-1, homologs of core circadian clock genes. Dev. Cell 8, 287–295. Abstract Article
Bargmann, C.I., Hartwieg, E., and Horvitz, H.R. (1993). Odorant-selective genes and neurons mediate olfaction in C. elegans. Cell 74, 515–527. Abstract Article
Barker, D.M. (1994a). Copulatory plugs and paternity assurance in the nematode Caenorhabditis elegans. Animal Behavior 48, 147–156. Article
Barker, D.M. (1994b). Copulatory plugs and paternity assurance in the nematode Caenorhabditis elegans. Animal Behaviour 48, 147–156. Article
Barr, M.M., DeModena, J., Braun, D., Nguyen, C.Q., Hall, D.H., and Sternberg, P.W. (2001). The Caenorhabditis elegans autosomal dominant polycystic kidney disease gene homologs lov-1 and pkd-2 act in the same pathway. Curr. Biol. 11, 1341–1346. Abstract Article
Barr, M.M., and Sternberg, P.W. (1999). A polycystic kidney-disease gene homologue required for male mating behaviour in C. elegans. Nature 401, 386–389. Abstract Article
Bettinger, J.C., and McIntire, S.L. (2004). State-dependency in C. elegans. Genes Brain Behav. 3, 266–272. Abstract Article
Brenner, S. (1974). The genetics of Caenorhabditis elegans. Genetics 77, 71–94. Abstract
Brockie, P.J., Mellem, J.E., Hills, T., Madsen, D.M., and Maricq, A.V. (2001). The C. elegans glutamate receptor subunit NMR-1 is required for slow NMDA-activated currents that regulate reversal frequency during locomotion. Neuron 31, 617–630. Abstract Article
Chalfie, M., and Au, M. (1989). Genetic control of differentiation of the C. elegans touch receptor neurons. Science 243, 1027–1033. Abstract
Chalfie, M., and Sulston, J. (1981). Developmental genetics of the mechanosensory neurons of Caenorhabditis elegans. Dev. Biol. 82, 358–370. Abstract Article
Chalfie, M., Sulston, J.E., White, J.G., Southgate, E., Thomson, J.N., and Brenner, S. (1985). The neural circuit for touch sensitivity in C. elegans. J. Neurosci. 5, 956–964. Abstract
Chalfie, M., and Wolinsky, E. (1990). The identification and suppression of inherited neurodegeneration in Caenorhabditis elegans. Nature 345, 410–416. Abstract Article
Chao, M.Y., Komatsu, H., Fukuto, H.S., Dionne, H.M., and Hart, A.C. (2004). Feeding status and serotonin rapidly and reversibly modulate a Caenorhabditis elegans chemosensory circuit. Proc. Natl. Acad. Sci. USA 101, 15512–15517. Abstract Article
Chiba, C.M., and Rankin, C.H. (1990). A developmental analysis of spontaneous and reflexive reversals in the nematode Caenorhabditis elegans. J. Neurobiol. 21, 543–554. Abstract Article
Colbert, H.A., and Bargmann, C.I. (1995). Odorant-specific adaptation pathways generate olfactory plasticity in C. elegans. Neuron 14, 803–812. Abstract Article
Croll, N.A. (1975). Components and patterns in the behavior of the nematode Caenorhabditis elegans. J. Zool. 176, 159–176.
Cully, D.F., Vassilatis, D.K., Liu, K.K., Paress, P.S., Van der Ploeg, L.H., Schaeffer, J.M., and Arena, J.P. (1994). Cloning of an avermectin-sensitive glutamate-gated chloride channel from Caenorhabditis elegans. Nature 371, 707–711. Abstract Article
Culotti, J.G., and Russell, R.L. (1978). Osmotic avoidance defective mutants of the nematode Caenorhabditis elegans. Genetics 90, 243–256. Abstract
Davies, A.G., Bettinger, J.C., Thiele, T.R., Judy, M.E., and McIntire, S.L. (2004). Natural variation in the npr-1 gene modifies ethanol responses of wild strains of C. elegans. Neuron 42, 731–743. Abstract Article
Davies, A.G., and McIntire, S.L. (2004). Using C. elegans to screen for targets of ethanol and behavior-altering drugs. Biol. Proced. Online 6, 113–119. Abstract Article
Davies, A.G., Pierce-Shimomura, J.T., Kim, H., VanHoven, M.K., Thiele, T.R., Bonci, A., Bargmann, C.I., and McIntire, S.L. (2003). A central role of the BK potassium channel in behavioral responses to ethanol in C. elegans. Cell 115, 655–666. Abstract Article
de Bono, M., and Bargmann, C.I. (1998). Natural variation in a neuropeptide Y receptor homolog modifies social behavior and food response in C. elegans. Cell 94, 679–689. Abstract Article
Dent, J.A., Smith, M.M., Vassilatis, D.K., and Avery, L. (2000). The genetics of ivermectin resistance in Caenorhabditis elegans. Proc. Natl. Acad. Sci. USA 97, 2674–2679. Abstract Article
Desai, C., and Horvitz, H.R. (1989). Caenorhabditis elegans mutants defective in the functioning of the motor neurons responsible for egg-laying. Genetics 121, 703–721. Abstract
Dusenbery, D.B., Sheridan, R.E., and Russell, R.L. (1975). Chemotaxis-defective mutants of the nematode Caenorhabditis elegans. Genetics 80, 297–309. Abstract
Ellerbrock, B.R., Coscarelli, E.M., Gurney, M.E., and Geary, T.G. (2004). Screening for presenilin inhibitors using the free-living nematode, Caenorhabditis elegans. J. Biomol. Screen. 9, 147–152. Abstract Article
Emmons, S.W., and Sternberg, P.W. (1997). Male development and mating behavior. In C. elegans II, D.L. Riddle, T. Blumenthal, B.J. Meyer, and J.R. Priess, eds. (Cold Spring Harbor, NY: Cold Spring Harbor Laboratory Press), pp. 295–334.
Feng, Z., Cronin, C.J., Wittig, J.H., Jr., Sternberg, P.W., and Schafer, W.R. (2004). An imaging system for standardized quantitative analysis of C. elegans behavior. BMC Bioinformatics 5, 115. Abstract Article
Ferguson, E.L., and Horvitz, H.R. (1985). Identification and characterization of 22 genes that affect the vulval cell lineages of the nematode Caenorhabditis elegans. Genetics 110, 17–72. Abstract
Geng, W., Cosman, P., Palm, M., and Schafer, W. (2005). C. elegans egg-laying detection and behavior study using image analysis. EURASIP J. App. Sig. Proc. in press.
Gray, J.M., Karow, D.S., Lu, H., Chang, A.J., Chang, J.S., Ellis, R.E., Marletta, M.A., and Bargmann, C.I. (2004). Oxygen sensation and social feeding mediated by a C. elegans guanylate cyclase homologue. Nature 430, 317–322. Abstract Article
Hardaker, L.A., Singer, E., Kerr, R., Zhou, G., and Schafer, W.R. (2001). Serotonin modulates locomotory behavior and coordinates egg-laying and movement in Caenorhabditis elegans. J. Neurobiol. 49, 303–313. Abstract Article
Hart, A.C., Kass, J., Shapiro, J.E., and Kaplan, J.M. (1999). Distinct signaling pathways mediate touch and osmosensory responses in a polymodal sensory neuron. J. Neurosci. 19, 1952–1958. Abstract
Hart, A.C., Sims, S., and Kaplan, J.M. (1995). Synaptic code for sensory modalities revealed by C. elegans GLR-1 glutamate receptor. Nature 378, 82–85. Abstract Article
Hedgecock, E.M., and Russell, R.L. (1975). Normal and mutant thermotaxis in the nematode Caenorhabditis elegans. Proc. Natl. Acad. Sci. USA 72, 4061–4065. Abstract
Hilliard, M.A., Bargmann, C.I., and Bazzicalupo, P. (2002). C. elegans responds to chemical repellents by integrating sensory inputs from the head and the tail. Curr. Biol. 12, 730–734. Abstract Article
Hilliard, M.A., Bergamasco, C., Arbucci, S., Plasterk, R.H., and Bazzicalupo, P. (2004). Worms taste bitter: ASH neurons, QUI-1, GPA-3 and ODR-3 mediate quinine avoidance in Caenorhabditis elegans. EMBO J. 23, 1101–1111. Abstract Article
Hobert, O., Moerman, D.G., Clark, K.A., Beckerle, M.C., and Ruvkun, G. (1999). A conserved LIM protein that affects muscular adherens junction integrity and mechanosensory function in Caenorhabditis elegans. J. Cell Biol. 144, 45–57. Abstract Article
Hodgkin, J. (1983). Male phenotypes and mating efficiency in Caenorhabditis elegans. Genetics 103, 43–64.
Hodgkin, J., and Doniach, T. (1997). Natural variation and copulatory plug formation in Caenorhabditis elegans. Genetics 146, 149–164. Abstract
Hodgkin, J., Edgley, M., Riddle, D.L., and Albertson, D.G. (1988). Genetics. In: The Nematode C. elegans, W.B. Wood, ed.
Hodgkin, J., Horvitz, H.R., and Brenner, S. (1079). Nondisjunction mutants of the nematode Caenorhabditis elegans. Genetics 91, 67–94. Abstract
Ishihara, T., Iino, Y., Mohri, A., Mori, I., Gengyo-Ando, K., Mitani, S., and Katsura, I. (2002). HEN-1, a secretory protein with an LDL receptor motif, regulates sensory integration and learning in Caenorhabditis elegans. Cell 109, 639–649. Abstract Article
Jansen, G., Weinkove, D., and Plasterk, R.H. (2002). The G-protein gamma subunit gpc-1 of the nematode C. elegans is involved in taste adaptation. EMBO J. 21, 986–994. Abstract Article
Jeon, M., Gardner, H.F., Miller, E.A., Deshler, J., and Rougvie, A.E. (1999). Similarity of the C. elegans developmental timing protein LIN-42 to circadian rhythm proteins. Science 286, 1141–1146. Abstract Article
Kahn-Kirby, A.H., Dantzker, J.L., Apicella, A.J., Schafer, W.R., Browse, J., Bargmann, C.I., and Watts, J.L. (2004). Specific polyunsaturated fatty acids drive TRPV-dependent sensory signaling in vivo. Cell 119, 889–900. Abstract Article
Kaplan, J.M., and Horvitz, H.R. (1993). A dual mechanosensory and chemosensory neuron in C. elegans. Proc. Natl. Acad. Sci. USA 90, 2227–2231. Abstract
Kleemann, G. (2005) Mating behavior and intersexual mating interactions in the nematode Caenorhabditis elegans. Lincoln, NB: University of Nebraska.
Law, E., Nuttley, W.M., and van der Kooy, D. (2004). Contextual taste cues modulate olfactory learning in C. elegans by an occasion-setting mechanism. Curr. Biol. 14, 1303–1308. Abstract Article
Lee, R.Y., Sawin, E.R., Chalfie, M., Horvitz, H.R., and Avery, L. (1999). EAT-4, a homolog of a mammalian sodium-dependent inorganic phosphate cotransporter, is necessary for glutamatergic neurotransmission in Caenorhabditis elegans. J. Neurosci. 19, 159–167. Abstract
Lipton, J., Kleemann, G., Ghosh, R., Lints, R., and Emmons, S.W. (2004). Mate searching in Caenorhabditis elegans: a genetic model for sex drive in a simple invertebrate. J. Neurosci. 24, 7427–7434. Abstract Article
Liu, K.S., and Sternberg, P.W. (1995). Sensory regulation of male mating behavior in Caenorhabditis elegans. Neuron 14, 79–89. Abstract Article
Loer, C.M., and Kenyon, C.J. (1993). Serotonin-deficient mutants and male mating behavior in the nematode Caenorhabditis elegans. J. Neurosci. 13, 5407–5417. Abstract
Mellem, J.E., Brockie, P.J., Zheng, Y., Madsen, D.M., and Maricq, A.V. (2002). Decoding of polymodal sensory stimuli by postsynaptic glutamate receptors in C. elegans. Neuron 36, 933–944. Abstract Article
Mori, I., and Ohshima, Y. (1995). Neural regulation of thermotaxis in Caenorhabditis elegans. Nature 376, 344–348. Abstract Article
Nuttley WM, Atkinson-Leadbeater KP, Van Der Kooy D. (2002). Serotonin mediates food-odor associative learning in the nematode Caenorhabditis elegans. Proc. Natl. Acad. Sci. USA 99, 12449–12454.
Peden, E.M., and Barr, M.M. (2005). The KLP-6 kinesin is required for male mating behaviors and polycystin localization in Caenorhabditis elegans. Curr. Biol. 15, 394–404. Abstract Article
Pierce-Shimomura, J.T., Morse, T.M., and Lockery, S.R. (1999). The fundamental role of pirouettes in Caenorhabditis elegans chemotaxis. J. Neurosci. 19, 9557–9569. Abstract
Raizen, D.M., and Avery, L. (1994). Electrical activity and behavior in the pharynx of Caenorhabditis elegans. Neuron 12, 483–495. Abstract Article
Raizen, D.M., Lee, R.Y., and Avery, L. (1995). Interacting genes required for pharyngeal excitation by motor neuron MC in Caenorhabditis elegans. Genetics 141, 1365–1382. Abstract
Rankin, C.H. (1991). Interactions between two antagonistic reflexes in the nematode Caenorhabditis elegans. J. Comp. Physiol. [A] 169, 59–67. Abstract
Rankin, C.H., Beck, C.D., and Chiba, C.M. (1990). Caenorhabditis elegans: a new model system for the study of learning and memory. Behav. Brain Res. 37, 89–92. Abstract Article
Rankin, C.H., and Broster, B.S. (1992). Factors affecting habituation and recovery from habituation in the nematode Caenorhabditis elegans. Behav. Neurosci. 106, 239–249. Abstract Article
Rose, J.K., Kaun, K.R., and Rankin, C.H. (2002). A new group-training procedure for habituation demonstrates that presynaptic glutamate release contributes to long-term memory in Caenorhabditis elegans. Learn. Mem. 9, 130–137. Abstract Article
Rose, J.K., and Rankin, C.H. (2001). Analyses of habituation in Caenorhabditis elegans. Learn. Mem. 8, 63–69. Abstract Article
Ryu, W.S., and Samuel, A.D. (2002). Thermotaxis in Caenorhabditis elegans analyzed by measuring responses to defined Thermal stimuli. J. Neurosci. 22, 5727–5733. Abstract Article
Saeki, S., Yamamoto, M., and Iino, Y. (2001). Plasticity of chemotaxis revealed by paired presentation of a chemoattractant and starvation in the nematode Caenorhabditis elegans. J. Exp. Biol. 204, 1757–1764. Abstract
Satterlee, J.S., Ryu, W.S., and Sengupta, P. (2004). The CMK-1 CaMKI and the TAX-4 Cyclic nucleotide-gated channel regulate thermosensory neuron gene expression and function in C. elegans. Curr. Biol. 14, 62–68. Abstract Article
Sawin, E.R., Ranganathan, R., and Horvitz, H.R. (2000). C. elegans locomotory rate is modulated by the environment through a dopaminergic pathway and by experience through a serotonergic pathway. Neuron 26, 619–631. Abstract Article
Simon, J.M., and Sternberg, P.W. (2002). Evidence of a mate-finding cue in the hermaphrodite nematode Caenorhabditis elegans. Proc. Natl. Acad. Sci. USA 99, 1598–1603. Abstract Article
Sulston, J., Dew, M., and Brenner, S. (1975). Dopaminergic neurons in the nematode Caenorhabditis elegans. J. Comp. Neurol. 163, 215–226. Abstract Article
Suzuki, H., Kerr, R., Bianchi, L., Frokjaer-Jensen, C., Slone, D., Xue, J., Gerstbrein, B., Driscoll, M., and Schafer, W.R. (2003). In vivo imaging of C. elegans mechanosensory neurons demonstrates a specific role for the MEC-4 channel in the process of gentle touch sensation. Neuron 39, 1005–1017. Abstract Article
Thomas, J.H. (1990). Genetic analysis of defecation in Caenorhabditis elegans. Genetics 124, 855–872. Abstract
Trent, C., Tsuing, N., and Horvitz, H.R. (1983). Egg-laying defective mutants of the nematode Caenorhabditis elegans. Genetics 104, 619–647. Abstract
Troemel, E.R. (1999). Chemosensory signaling in C. elegans. Bioessays 21, 1011–1020. Abstract
Uchida, O., Nakano, H., Koga, M., and Ohshima, Y. (2003). The C. elegans che-1 gene encodes a zinc finger transcription factor required for specification of the ASE chemosensory neurons. Development 130, 1215–1224. Abstract
Voisine, C., and Hart, A.C. (2004). Caenorhabditis elegans as a model system for triplet repeat diseases. Methods Mol. Biol. 277, 141–160. Abstract
Waggoner, L.E., Dickinson, K.A., Poole, D.S., Tabuse, Y., Miwa, J., and Schafer, W.R. (2000). Long-term nicotine adaptation in Caenorhabditis elegans involves PKC-dependent changes in nicotinic receptor abundance. J. Neurosci. 20, 8802–8811. Abstract
Waggoner, L.E., Zhou, G.T., Schafer, R.W., and Schafer, W.R. (1998). Control of alternative behavioral states by serotonin in Caenorhabditis elegans. Neuron 21, 203–214. Abstract Article
Ward, S. (1973). Chemotaxis by the nematode Caenorhabditis elegans: identification of attractants and analysis of the response by use of mutants. Proc. Natl. Acad. Sci. USA 70, 817–821. Abstract
Way, J.C., and Chalfie, M. (1989). The mec-3 gene of Caenorhabditis elegans requires its own product for maintained expression and is expressed in three neuronal cell types. Genes Dev. 3, 1823–1833. Abstract
Weinshenker, D., Garriga, G., and Thomas, J.H. (1995). Genetic and pharmacological analysis of neurotransmitters controlling egg-laying in C. elegans. J. Neurosci. 15, 6975–6985. Abstract
Wicks, S.R., de Vries, C.J., van Luenen, H.G., and Plasterk, R.H. (2000). CHE-3, a cytosolic dynein heavy chain, is required for sensory cilia structure and function in Caenorhabditis elegans. Dev. Biol. 221, 295–307. Abstract Article
Wicks, S.R., and Rankin, C.H. (1995). Integration of mechanosensory stimuli in Caenorhabditis elegans. J. Neurosci. 15, 2434–2444. Abstract
Wittenburg, N., and Baumeister, R. (1999). Thermal avoidance in Caenorhabditis elegans: an approach to the study of nociception. Proc. Natl. Acad. Sci. USA 96, 10477–10482. Abstract Article
Zhang, S., Arnadottir, J., Keller, C., Caldwell, G.A., Yao, C.A., and Chalfie, M. (2004). MEC-2 is recruited to the putative mechanosensory complex in C. elegans touch receptor neurons through its stomatin-like domain. Curr. Biol. 14, 1888–1896. Abstract Article
Zhang, Y., and Chalfie, M. (2002). MTD-1, a touch-cell-specific membrane protein with a subtle effect on touch sensitivity. Mech. Dev. 119, 3–7. Abstract Article
Zhao, B., Khare, P., Feldman, L., and Dent, J.A. (2003). Reversal frequency in Caenorhabditis elegans represents an integrated response to the state of the animal and its environment. J. Neurosci. 23, 5319–5328. Abstract
*Edited by Victor Ambros. Last revised June 02, 2005. Published July 3, 2006. This chapter should be cited as: Hart, Anne C., ed. Behavior (July 3, 2006), WormBook, ed. The C. elegans Research Community, WormBook, doi/10.1895/wormbook.1.87.1, http://www.wormbook.org.
Copyright: © 2006 Anne C. Hart and contributors. This is an open-access article distributed under the terms of the Creative Commons Attribution License, which permits unrestricted use, distribution, and reproduction in any medium, provided the original author and source are credited.
§To whom correspondence should be addressed. E-mail: hart@helix.mgh.harvard.edu
 All WormBook content, except where otherwise noted, is licensed under a Creative Commons Attribution License.