 Embryo series courtesy of Einhard Schierenberg
Table of Contents
Abstract
C. elegans presents a low level of molecular diversity, which may be explained by its selfing mode of reproduction. Recent work on the genetic structure of natural populations of C. elegans indeed suggests a low level of outcrossing, and little geographic differentiation because of migration. The level and pattern of molecular diversity among wild isolates of C. elegans are compared with those found after accumulation of spontaneous mutations in the laboratory. The last part of the chapter reviews phenotypic differences among wild isolates of C. elegans.
Most studies on C. elegans use a single genetic background, that of the N2 strain. Its biological features as unravelled in the laboratory may be better interpreted with more knowledge of their evolutionary origin and ecological significance. Moreover, the diversity of wild isolates is a source of phenotypic variations that can be studied like mutant phenotypes.
In addition, the mode of reproduction of C. elegans makes it a great system to study the regulation, consequences and evolution of outcrossing versus selfing breeding systems. Obvious questions concern the frequency of outcrossing, the geographic structure of populations (are populations locally clonal?) and the fate of deleterious mutations. Although evolutionary and ecological studies of C. elegans have been scarce until a few years ago, its short generation time, the ease of obtaining isogenic lines by selfing and the ability to retain frozen stocks make it a model system with a future in evolutionary biology.
We will successively review what is currently known about I. its molecular diversity and the genetic structure of populations, and II. its phenotypic diversity.
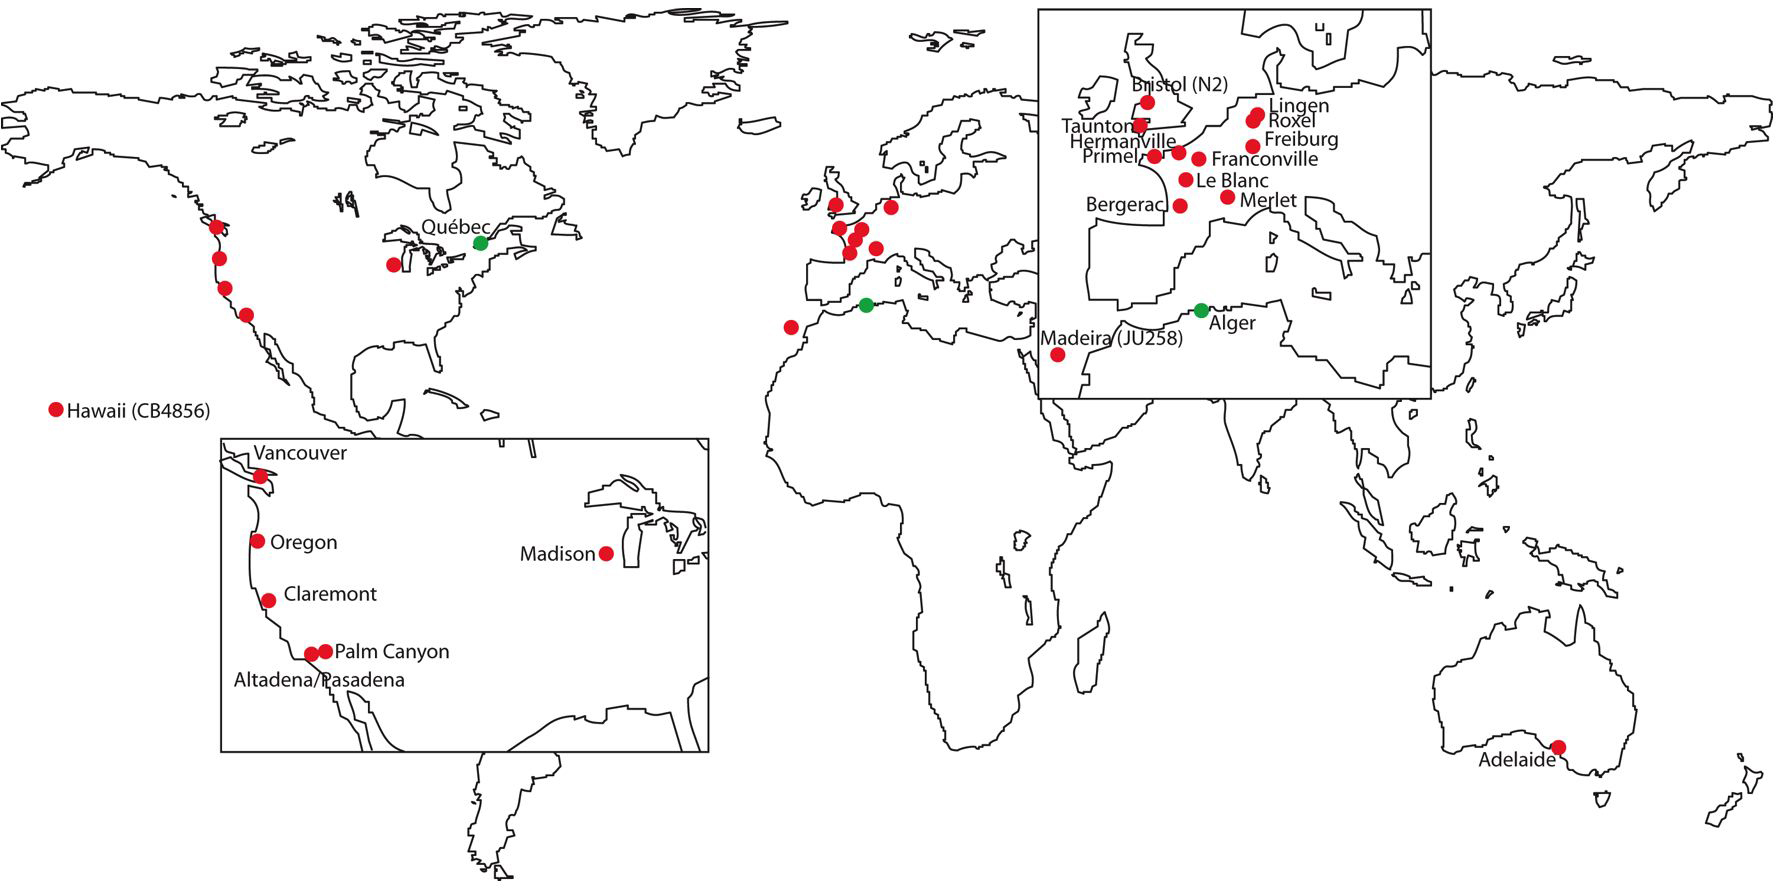
Early work on molecular polymorphisms in C. elegans was based on a set of natural isolates that were collected worldwide over many years, each kept as a single selfing isogenic strain (available at CGC). These isolates come from North America (mostly California), Western Europe (including N2, the reference strain, isolated in Bristol, U.K.) and Adelaide (Australia); one isolate, CB4856, was sampled in Hawaii and is used for SNP mapping (see SNPs: introduction and 2-point mapping; Hodgkin and Doniach, 1997; Figure 1). These isolates are used as representatives of the molecular and phenotypic variation within the species, even though they may miss a signifcant part of it, due to geographically restricted sampling. C. elegans could never be isolated in samples from Asia (unlike C. briggsae), but not much sampling was attempted in Africa nor South America.
|
Figure 1. Geographic origin of available C. elegans wild isolates. Red dots: origin of available wild isolates, either through the CGC or at http://www2.ijm.jussieu.fr/worms/index.php. Green dots: sampling sites where C. elegans was also found, but not conserved, in Algeria (original isolates by Maupas, 1900) and Québec (Abdul Kader and Côté, 1996).
Recently, several sets of wild isolates were collected from Western Europe and California (plus one strain from Madeira; Haber et al., 2005; Barrière and Félix, 2005; Sivasundar and Hey, 2005). Several strains were established from a given sample, giving an insight of diversity within a local population.
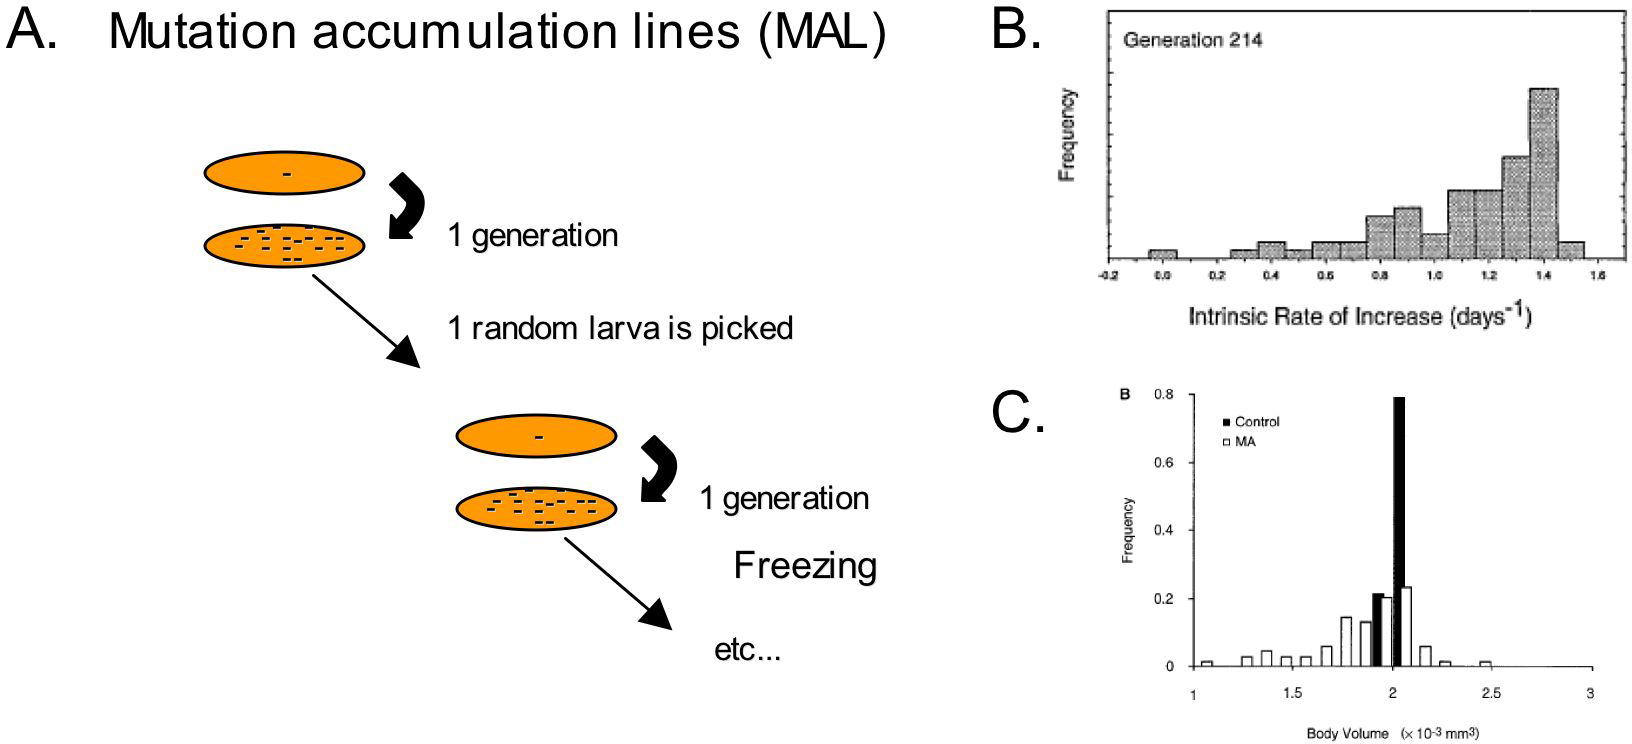
The level and pattern of genetic diversity depend on the rate and pattern of mutation, which can be measured after accumulation of spontaneous mutations in the laboratory. Mutation accumulation (MA) lines are established by picking a single individual at each generation, therefore limiting natural selection as much as possible (Figure 2). They represent the raw mutational process, whereas the diversity observed among wild isolates is the result of mutation as well as population structure and phenotypic selection. We first review for mitochondrial and nuclear DNA the observed molecular diversity in wild isolates, then the mutation rate and pattern in MA lines, and compare them to reveal the action of selection in natural populations.
|
Figure 2. Mutation accumulation lines. A. Mutation accumulation lines are obtained by transferring a single larva at each generation for many generations. Spontaneous mutations accumulate, with minimal selection. Many lines are kept in parallel, and can be frozen at intervals to keep a record of their evolution. Due to the accumulation of highly deleterious mutations, some lines are lost: from 100 original lines, only 58 were kept up to 396 generations (Vassilieva et al., 2000). B. Frequency distribution between the different mutation accumulation lines of a fitness measure (the intrinsic rate of increase) after 214 generations (Vassilieva et al., 2000). C. Frequency distribution of body size between the same lines at an average of 152 generations (Azevedo et al., 2002).
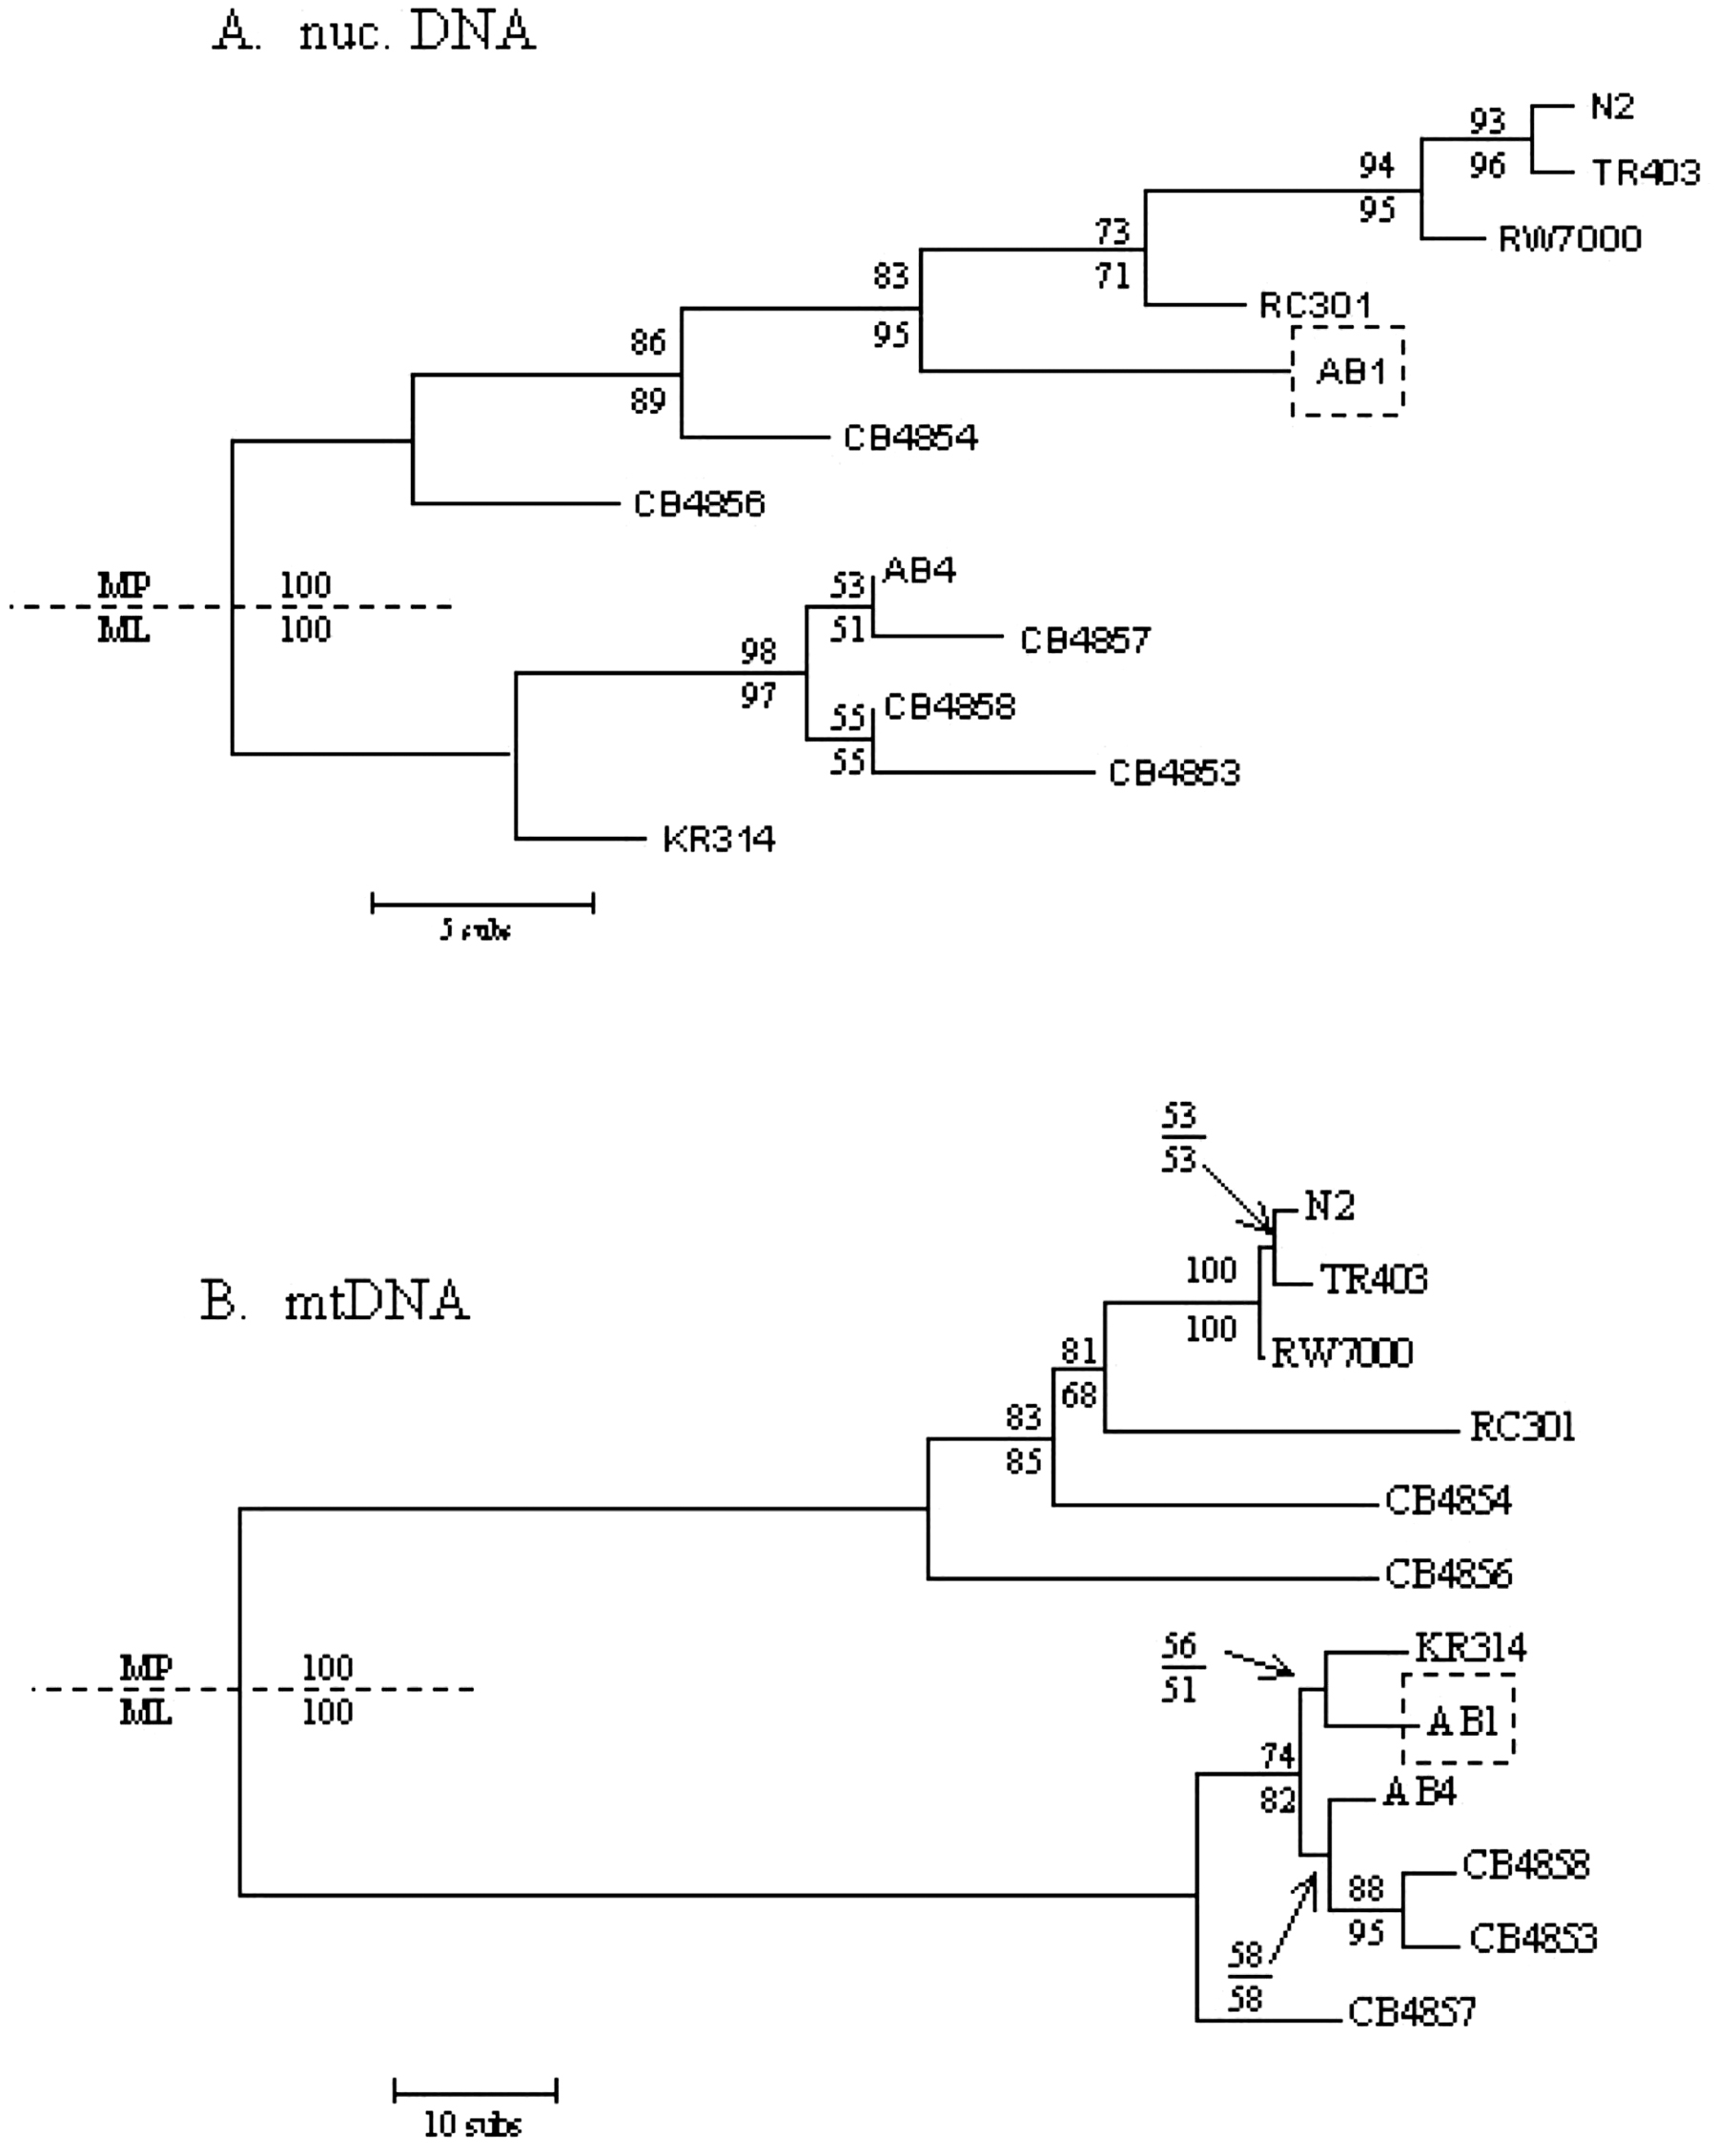
Denver et al. (2003) sequenced the nearly complete mitochondrial genome of 27 C. elegans natural isolates. Mitochondrial sequences were found to cluster in two well-defined clades, called I and II (Figure 3). N2 and CB4856 both belong to clade I. Several isolates have the same mitochondrial DNA sequence as N2.
The mutation rate and pattern of mitochondrial DNA were assessed in mutation accumulation lines (Denver et al., 2000). 26 mutations were recorded, 16 of which were base substitutions, yielding a rate of 9.7 × 10⁻⁸ mutation per site per generation (Table 1).
Table 1. Mutation rates in mutation accumulation lines (MA) and mutational pattern in MA lines versus wild isolates
| DNA | Strains | Mutation rate* | Subst/Indel (total) | Ts/Tv | Repl : Syn | Reference |
|---|---|---|---|---|---|---|
| Mitochondrial | MA | 1.6 × 10⁻⁷ | 1.6 (26) | 4.3 | 9 : 6 | Denver et al., 2000 |
| 27 wild isolates | 237 (238) | 2.6 | 33 : 172 | Denver et al., 2003 | ||
| Nuclear | MA | 2.1 × 10⁻⁸ | 0.76 (30) | 1.6 | Denver et al., 2004 | |
| CB4856 vs. N2 | 2.6 | 1.3 | Swan et al., 2002 & Wicks et al., 2001 | |||
| 18 wild isolates | 3.9 (54) | 1.7 | Denver et al., 2003 | |||
| Homopolymers | MA | 4.5 × 10⁻⁶ to 1.5 × 10⁻⁴ | – | – | Denver et al., 2004 | |
| Microsatellites | MA | 8.9 × 10⁻⁵ to 1.8 × 10⁻² | – | – | Frisse, 1999 | |
| “Subst/Indel”: ratio of nucleotide substitutions over insertion-deletion events. “Ts/Tv”: ratio of transitions over transversions among substitutions. “Repl : Syn”: number of amino-acid replacements and synonymous nucleotide substitutions. | ||||||
| *: mutation rate is per base pair per generation for mitochondrial and nuclear sequences, and per locus per generation for homopolymers and microsatellites. | ||||||
|
Figure 3. Phylogenetic analysis of C. elegans hermaphrodite lineages using nuclear and mitochondrial DNA sequences. Phylogenetic analysis of C. elegans hermaphrodite lineages using mtDNA and nuclear sequences. Bootstrap values (maximum parsimony and maximum likelihood) are indicated at each node. AB1 is the only strain whose placement differs in the two trees, suggesting that it is the product of recombination between two divergent genotypes. A. Bootstrap consensus tree for C. elegans natural isolates, using 70 nuclear variable sites from Denver et al. (2003) and Koch et al. (2000). Note that in the latter set, most SNPs were found by sequencing CB4857. B. Unrooted phylogram of the C. elegans natural isolates using 11,443 bp of mitochondrial DNA sequences. From Denver et al. (2003).
The comparison of the mutation pattern in MA lines versus wild isolates suggests that the excess of transitions over transversions in wild isolates is due to a mutational bias. In contrast, indels and replacement mutations in coding regions are less frequent among wild isolates than in MA lines, suggesting that they are counterselected (Table 1; Denver et al., 2000).
The nuclear polymorphism level was first measured by sequencing random regions of the genome of four wild isolates: AB1, CB4857, RC301 and TR403 (Koch et al., 2000). Extensive shotgun data (12 Mb) were then obtained for CB4856, which harbours variant polymorphisms distributed over the whole genome (compared to N2), allowing its use for genetic mapping of mutations (see SNPs: introduction and 2-point mapping; Swan et al., 2002; Wicks et al., 2001). A random 44 kb set was also sequenced in 18 strains (those in Figure 3; Denver et al., 2003). CB4856 and N2 differ by one polymorphism per 840 bp or 1.2 × 10⁻³ per nucleotide (Swan et al., 2002; Wicks et al., 2001). The other sequenced strains are less divergent (Table 2). Overall, the level of polymorphism is low in C. elegans.
Table 2. Pairwise molecular distances between N2 and other wild isolates
| Strain | Distance to N2 (× 103 bp-1) | Reference |
|---|---|---|
| CB4856 | 2.7 | Denver et al., 2003 |
| CB4856 | 1.2 | Swan et al., 2002; Wicks et al., 2001 |
| CB4857 | 0.7 | Koch et al., 2000 |
| AB1 | 0.4 | Koch et al., 2000 |
| RC301 | 0.13 | Koch et al., 2000 |
| TR403 | 0.11 | Koch et al., 2000 |
| TR403 | 0.07 | Denver et al., 2003 |
Whole-genome diversity was also investigated using AFLP (Amplified Fragment Length Polymorphism), a whole-genome fingerprinting technique, on four populations from France (Barrière and Félix, 2005). For sampling, individuals (12–19/location) were picked as they crawled out of the substrate, avoiding as much as possible post-sampling selection and ensuring a true representation of natural population diversity. Across the four French populations, the AFLP fragment diversity is Hj = 4.9 (SE 0.9). An approximate conversion to nucleotide diversity gives a π = 0.81 × 10⁻³ per nucleotide (Table 3).
Table 3. Nucleotide diversity
| Locus | Wild isolates | Nucleotide diversity (× 103) | Replacement : synonymous | Reference |
|---|---|---|---|---|
| COII (696 bp; mitochondrial) | 11 (worldwide) | 4.6 | Thomas and Wilson, 1991 | |
| 20 (worldwide) | 10.2 | 1 : 14 | Graustein et al., 2002 | |
| cal-1 (838 bp) | 11 (worldwide) | 0.0 | 0 : 0 | Thomas and Wilson, 1991 |
| odr-3 (2652 bp) | 10 (worldwide) | 0.08 | 0 : 2 | Jovelin et al., 2003 |
| glp-1 (547 bp) | 20 (worldwide) | 0.9 | 0 : 1 | Graustein et al., 2002 |
| spe-9 (1869 bp) | 20 (worldwide) | 0.3 | 2 : 4 | Graustein et al., 2002 |
| tra-2 (670 bp) | 20 (worldwide) | 0.0 | 0 : 0 | Graustein et al., 2002 |
| Whole genome AFLP | several populations (France) | 0.81 | – | Barrière and Félix, 2005 |
| Whole genome AFLP | within populations | 0.02 to 0.43 | – | Barrière and Félix, 2005 |
| Molecular diversity can be expressed as a pairwise distance between two genomes (Table 2). When more than two strains are compared, the standard measure of genetic diversity (Nei's genetic diversity) is the probability of two randomly sampled alleles to be different for the type of polymorphism considered (for example, nucleotide diversity, noted π). This measure takes into account the frequency of each allele in the population of samples. The conversion of AFLP fragment diversity to nucleotide diversity is approximate, but does not affect the ratio of local vs. global diversity estimates. | ||||
The nuclear mutation rate was estimated in MA lines to 2.1 × 10⁻⁸ per nucleotide site (or 2.1 mutations per haploid genome) per generation (Denver et al., 2004). 17 out of 30 observed mutations were indels, among which insertions were dominant (13 out of 17). This contrasts with the pattern observed among wild isolates in putatively neutral regions such as transposon pseudogenes, where deletions are 2.8 times more frequent than insertions (Witherspoon and Robertson, 2003); therefore, data obtained on putative pseudogenes should be taken carefully, as selection may not be fully suppressed. It is also possible that the MA data, obtained in the N2 genetic background, are not representative of the mutational pattern that gave rise to the present diversity in the species.
The comparison of MA lines versus wild isolates shows that indels are counterselected (Table 1). Also, polymorphisms in exons are two-fold underrepresented in wild isolates (Koch et al., 2000; Denver et al., 2003). Polymorphisms in coding regions show a clear bias towards third base position, more prone to silent mutations, reflecting the selection on coding sequences.
At the chromosomal level, polymorphisms are more frequent in distal arm regions than in the central clusters (Koch et al., 2000; Wicks et al., 2001; Swan et al., 2002; see Karyotype, ploidy and gene dosage). At a finer scale, different genes show a wide diversity of nucleotide polymorphism levels (Denver et al., 2003; Stewart et al., 2004).
A few genes have been sequenced in a large set of wild isolates (Thomas and Wilson, 1991; Graustein et al., 2002; Jovelin et al., 2003). The overall level of polymorphism found is very low. In some cases, no polymorphism was found at all over hundreds of base pairs (Table 3).
Stewart et al. (2004) sequenced in 20 wild isolates 31 chemoreceptor genes from the srh and str families that are pseudogenes in the N2 strain. For 10 of these genes, functional alleles are present in some wild isolates. Half of these genes apparently became non-functional by a substitution creating a stop codon, and half through a deletion affecting the reading frame. Five of the putatively functional alleles were only found in CB4856 and JU258. The other polymorphisms observed in the same gene sequences also make CB4856 and JU258 the most divergent strains compared to N2, with 25 and 14 polymorphisms, respectively (compared to 4 polymorphisms in Bergerac/RW7000, the third most divergent strain). Overall, chemoreceptor genes appear to have a 5- to 10-fold higher level of polymorphism than the whole genome average, and different genes showed widely different polymorphism levels, from 15 polymorphisms in 9.4 kb to none in 17 kb.
Microsatellites are short repeated sequences (ranging from two to six nucleotides), which are highly prone to slippage during replication, and therefore highly mutable. Microsatellite mutation rates in MA lines range from 8.93 × 10⁻⁵ to 1.85 × 10⁻² per locus per generation, depending of the size and nature of the repeats (Frisse, 1999; Sivasundar and Hey, 2003). Mononucleotide microsatellites, also called homopolymeric loci, are sequences of eight or more repeats of a single nucleotide; 30 length change mutations and one base substitution were identified in homopolymers in MA lines (Denver et al., 2004), giving a mutation rate range from 4.5 × 10⁻⁶ per generation for A/T homopolymers to 1.5 × 10⁻⁴ per generation for long G/C homopolymers (Table 1). 2% of homopolymers are found in protein-coding sequences, which results in an average of 0.03 homopolymer mutation in exon sequence per genome per generation.
Sivasundar and Hey (2003) genotyped 20 dinucleotide microsatellite loci in 23 wild isolates of C. elegans. Only half of these loci were polymorphic, with a mean of 6.2 alleles (range 3–12). The low diversity (or lack of it) in some microsatellites correlates with the low number of true repeats, as pointed out by Haber et al. (2005).
Haber et al. (2005) sequenced 10 tri- or tetra-nucleotide repeats in 58 natural isolates. All but one were found to be polymorphic, with an average allele number of seven.
While data from Haber et al. (2005) fit the infinite allele mutation model (every mutation creates a new allele), those from Sivasundar and Hey (2003) better fit the stepwise mutation model (mutations occur by insertion or deletion of a single repeat), which is also suggested by the MA line pattern (Frisse, 1999; Sivasundar and Hey, 2003).
An important parameter in population genetics is the effective population size (Ne), which represents the number of individuals of an equivalent ideal random-mating population under mutation and genetic drift, or the number of individuals contributing to the next generation. It is calculated from the mutation rate μ and the observed molecular diversity π from π = 4Neμ. For a given mutation rate, it is thus equivalent to a measure of molecular diversity. Practically, Ne is reduced by inbreeding or non-random mating due to geographical structure, and is almost always smaller than the number of breeding individuals (Hartl and Clark, 1997; Charlesworth et al., 2003).
Estimates of Ne from microsatellites for the whole species range from 200 to 44,000, depending on which locus is considered (Sivasundar and Hey, 2003). From AFLP data, it was estimated to be 9,600 for the four samples over France (Barrière and Félix, 2005). These numbers are surprisingly small for such a widespread species with large local populations (densities of C. elegans can reach 10 individuals / g in a compost heap; Barrière and Félix, 2005; and on decaying mushroom compost numbers are far larger; A. Cutter and E. Dolgin, pers. comm.).
At least in the locations sampled so far, C. elegans presents a low genetic diversity, comparable to that of humans and 20-fold lower than that found in Drosophila melanogaster. Its molecular mutation rate is not particularly low. The level of genetic diversity depends on the structure of natural populations. For example, Homo sapiens has a low nucleotide diversity, due to a recent bottleneck in the population. The pattern of microsatellite diversity of C. elegans does not show evidence for a recent global bottleneck followed by population expansion (Sivasundar and Hey, 2003). The reproductive mode also influences genetic diversity, which is expected to be reduced in partial selfers such as C. elegans or Arabidopsis thaliana: selfing results in a two-fold reduction in effective population size, and genetic diversity is further reduced by the fact that selection at one locus results in the selection of the entire genome under genetic linkage (Hartl and Clark, 1997). We will now review the geographic structuring and the reproductive mode of C. elegans.
When the natural isolates are partitioned by world region, most of the genetic variation is found within a continent: for example, the microsatellite genetic diversities within North America and Europe are of 0.83 and 0.85, respectively, which is close to the 0.92 diversity over the whole dataset (Haber et al., 2005).
At a local scale, Haber et al. (2005) and Sivasundar and Hey (2005) found microsatellite polymorphism within compost heaps in Germany, and soil samples in California, respectively. Effective population size estimates range from 750 to 12,000 in different local populations. In these two sets of samples, individuals were isolated after several (five to 24) days in the laboratory and may therefore have been the progeny (F1–F5) of wild individuals and thus not faithfully represent diversity in the corresponding natural populations.
Barrière and Félix picked independent wild-born individuals directly from the substrate. Using AFLP analysis, estimates for within-population nucleotide diversity range from 0.02 to 0.43 × 10⁻³ per nucleotide for different populations (Ne = 200–5,100; Table 2). The within-sample diversity is spread over a large range, from almost null to a level of diversity comparable to the global diversity (and to the distance between N2 and CB4856). In cases where the intra-sample diversity was low, a diversity of 0.80 × 10⁻³ was recovered when three samples were sampled 10–30 meters away (Barrière and Félix, 2005).
Thus, local diversity seems to remain high until the scale of a few cm3. In some samples, it then breaks down, probably as a consequence of local bottlenecks followed by selfing of a single individual (see section 1.4). The large variance in within-sample diversity may also reflect a lack of demographic stability in some populations, with transient bottlenecks that reduce genetic diversity. Together with known ecological features of C. elegans, this suggests that a metapopulation dynamics (many small populations, experiencing frequent extinctions and de novo colonizations) could apply to its natural populations.
Local diversity may be the result of local mutation or of input of alleles through migration, which can be distinguished by measuring the frequency of different alleles in different populations.
Allelic frequencies correlate only weakly with geographic origin among the sampled world regions (Western Europe, North America, Australia, Hawaii, Madeira; Sivasundar and Hey, 2003; Haber et al., 2005). Indeed, isolates from the same region can be significantly divergent, whereas very similar genotypes are found on different continents (Hodgkin and Doniach, 1997; Koch et al., 2000). At a smaller scale in the four populations sampled in France, for more than half of polymorphisms within each population, both alleles are also found outside this population (Barrière and Félix, 2005), suggesting that local diversity is fostered by either a large population size at population foundation, or later migration. Moreover, no correlation was found between geographical and genetic distances (Sivasundar and Hey, 2003; Barrière and Félix, 2005), thus further suggesting that the migration rate is large enough that isolation by distance does not contribute substantially.
These results suggest that C. elegans is a better migrant than previously thought. The dauer larva is likely to be a dispersal stage, through its association with other animals (see The phylogenetic relationships of Caenorhabditis and other rhabditids). Because C. elegans is easily found within gardens and compost heaps, human activity may also be a major factor in its present migration patterns and distribution.
Two wild isolates however stand out in terms of level of divergence and specific alleles, namely CB4856 and JU258. 70% of the SNPs identified in CB4856/Hawaii were not found in nine other strains, indicating that this strain has significantly diverged (Koch et al., 2000). JU258/Madeira was not included in the earlier analyses, but now appears to share specific polymorphisms with CB4856 (Stewart et al., 2004; Haber et al., 2005). Much diversity may still be in store in undersampled parts of the world.
Among the Caenorhabditis species that are most closely related to C. elegans (Kiontke et al., 2004; see The phylogenetic relationships of Caenorhabditis and other rhabditids and The evolution of nematode sex determination), the level of genetic diversity appears to correlate with the mode of reproduction, being higher in the obligate outcrosser C. remanei.
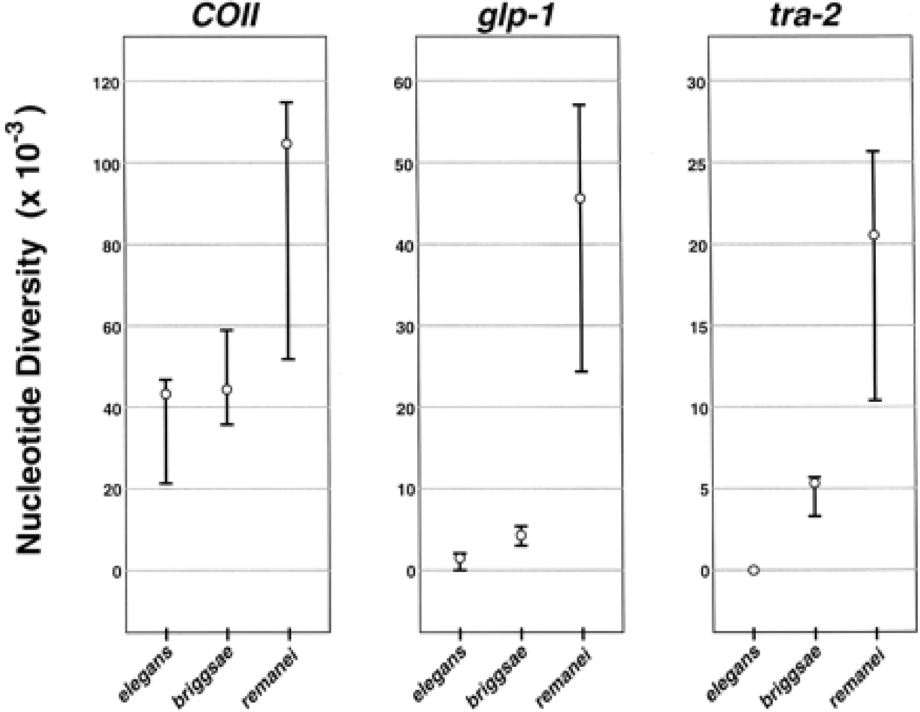
Graustein et al. (2002) compared nucleotide diversity of tra-2, glp-1 and COII in three species (Figure 4). The two selfing species, C. elegans and C. briggsae, show low levels of diversity, with C. briggsae being more polymorphic than C. elegans, while the outcrossing species, C. remanei, is highly polymorphic, from one to two orders of magnitude above C. elegans.
|
Figure 4. Silent site nucleotide diversity for three genes (COII, glp-1, and tra-2) in C. elegans, C. briggsae, and C. remanei. Open circles represent estimates of silent site nucleotide diversity that are based on pairwise sequence comparisons. Error bars represent the 95% confidence intervals for this estimate. The self-fertilizing species (C. elegans and C. briggsae) always harbor less variation than the cross-fertilizing species (C. remanei). This difference between mating systems is more pronounced for the two nuclear genes (glp-1 and tra-2) than for the mitochondrial gene (COII). From Graustein et al. (2002).
Similarly for the odr-3 gene, nucleotide diversity was found to be 0.08 × 10⁻³ per nucleotide in 10 C. elegans isolates, 1.2 × 10⁻³ in C. briggsae, and 12.9 × 10⁻³ in C. remanei, including one amino-acid replacement. The diversity within a single local C. remanei population is two orders of magnitude higher than in the whole C. elegans species (Jovelin et al., 2003).
Interestingly, other more distant hermaphroditic nematode species, Pristionchus pacificus (Srinivasan et al., 2001) and Oscheius tipulae (D. Baïlle and M.-A. F., unpublished), show much higher nucleotide diversity than C. elegans and C. briggsae. The mode of reproduction is clearly not the sole determinant of genetic diversity, and population dynamics is likely to be an important factor.
This low intraspecific diversity contrasts with a large divergence between the three species: 9.4% between C. elegans and C. briggsae, and 11.6 (Jovelin et al., 2003) to 11.9% (Thomas and Wilson, 1991) between C. briggsae and C. remanei, about 10-fold higher than intraspecific variation of C. remanei. The turnover of nucleotides at neutral sites is almost saturated between these different species (Shabalina and Kondrashov, 1999), which renders molecular evolution tests based on synonymous mutation rate difficult. On the other hand, polymorphism within C. elegans is so low that the amount of sequence information needed to look at DNA polymorphism patterns is large, and that for a given gene may not be very meaningful.
C. elegans reproduces through self-fertile XX hermaphrodites and facultative XO males (see Introduction to sex determination). Hermaphrodites first produce sperm, then oocytes, through meiotic divisions; hermaphrodites cannot cross-fertilize and males are required for outcrossing to occur. In laboratory conditions, hermaphrodites are limited by their sperm production to about 300 self-progeny, whereas males may have a much larger number of progeny. In outcrossing events, male sperm is more efficient in mating than hermaphrodite sperm, and in C. briggsae (AF16 strain), X-bearing male sperm is more efficient than non-X-bearing male sperm (LaMunyon and Ward, 1995; LaMunyon and Ward, 1997).
The outcrossing frequency depends on the rate of spontaneous male production and the mating efficiency. Males can be produced by i. non-disjunction of the X chromosome at meiosis; ii. mating of a XO male with a XX hermaphrodite.
In laboratory conditions, spontaneous non-disjunction of the X chromosome occurs at a low rate (about 1/1,000), which is subject to genetic variation (Hodgkin and Doniach, 1997) and is altered by environmental factors such as temperature (Nigon, 1949).
When N2 males are placed in culture with hermaphrodites at an initial 50% frequency, their proportion is rapidly reduced to the non-disjunction equilibrium, due to a low mating ability and the apparent absence of an advantage for outcrossed over selfed progeny (Hodgkin, 1983; Chasnov and Chow, 2002; Stewart and Phillips, 2002; Cutter and Payseur, 2003).
Males from other strains of C. elegans, such as CB4855 and CB4856, have higher mating ability (Hodgkin and Doniach, 1997; J. Hodgkin, pers. comm.). Moreover, we cannot generalize from these observations to wild individuals in their natural environment.
Outcrossing in the wild can be detected by several methods:
Recombination of alleles at different loci
The most sensitive method for detecting outcrossing is based on reassortments of alleles at different loci in the genome. If C. elegans only reproduced by selfing, different loci would follow the same tree lineage as mitochondrial DNA, and the whole genome would behave as a single genetic linkage block. Indeed, a partial but significant correlation between phylogenies built from either nuclear or mitochondrial sequence data (Figure 3) suggests that outcrossing occurs, but is rare in C. elegans (Denver et al., 2003).
Outcrossing can be inferred when all four combinations of two alleles at two loci are found (4-gamete test; Hudson and Kaplan, 1985), or by mapping the occurrence of an allele onto an independently established tree, provided there is no homoplasy (that is, no convergent mutations). Many such putative recombination events were found using sequence (Koch et al., 2000; Denver et al., 2003; Haber et al., 2005) or AFLP data (Barrière and Félix, 2005). Yet large chromosomal regions appear to remain linked, suggesting little outcrossing (Egilmez et al., 1995; Koch et al., 2000; Denver et al., 2003).
Linkage disequilibrium is a quantitative measure of association between polymorphic loci in a population; since the recombination frequency increases with outcrossing, linkage disequilibrium decreases. In Drosophila melanogaster populations, linkage disequilibrium only extends for 100 bp-1 kb. Within local C. elegans populations, linkage disequilibrium was found to be high for randomly chosen loci in the samples from Northwest Germany (Haber et al., 2005) and France (Barrière and Félix, 2005). The outcrossing rate can be estimated from linkage disequilibrium and effective population size. In two populations sampled in France, it was estimated to one outcrossing every 7,400 (95% confidence interval: 6,000–19,000) and 17,400 (95% c. i.: 1/3,200-complete selfing) generations, suggesting exceptional outcrossing.
At the global scale however, no linkage disequilibrium could be detected using random microsatellite markers (Sivasundar and Hey, 2003). It may be that microsatellites mutate too fast to detect the chromosomal linkage blocks suggested by Egilmez et al. (1995), Koch et al. (2000), Denver et al. (2003) at this scale of the whole species.
Presence of heterozygotes
Given the frequency of two alleles at a given locus in a population, the outcrossing frequency can be calculated from the observed frequency of heterozygotes (assuming non-assortative mating of different genotypes).
(Sivasundar and Hey, 2005) isolated C. elegans individuals using a RNA interference-based assay (performed several days after soil sample collection) and measured heterozygote frequency using microsatellite polymorphisms. From allele frequencies and the frequency of heterozygotes, they estimated the outcrossing rate in the wild ancestors at the time of sampling. For different populations sampled in Southern California, estimates range from complete selfing to one outcrossing every 5 generations, with a rate of one outcrossing every 7 generations over the whole dataset (i.e. an outcrossing rate of 14%).
Among individuals directly sampled from four natural populations from France, heterozygotes could also be detected using microsatellites, and the overall outcrossing rate estimated to 1% (Barrière and Félix, 2005). The difference between both studies may possibly result from variations between natural populations, either in the ecological context (for example seasonal or geographical variations in outcrossing rates) or in genetic variation in spontaneous-male-occurrence or fertility.
These heterozygote-based estimates do not seem compatible with the much lower estimates inferred from linkage disequilibrium data, and with the partial congruence of mitochondrial and nuclear phylogenies. However, the latter methods measure outcrossing over a longer time period, taking into account population structure, changes in selfing rate over time and possible mating preferences.
Presence of males
Outcrossing results in a high frequency of males in the next generation, since half of the cross-progeny is male. A survey of individual worms sampled directly from the wild (13 samples on 3 sampling sites over 6 months) found only two males out of 1,135 individuals (Barrière and Félix, 2005). This very low occurrence of males is fully compatible with the rate of spontaneous male production in the laboratory. These populations thus reproduce mostly by selfing, but occasional bursts of sexual reproduction would remain undetected by this criterion.
Overall, these results suggest that C. elegans overwhelmingly reproduces by selfing in the wild and that outcrossing is only occasional. Most likely, males produced by spontaneous X-chromosome non-disjunction only rarely mate. Since male mating results in more males, sexual reproduction in small populations is likely to occur by unstable bursts of variable duration. Recombination of genotypes is rendered possible by the coexistence of diverse genotypes in the same location. Outcrossing is sufficiently infrequent relative to the mutation rate that the genomes remain incompletely mixed over large chromosomal segments.
On an evolutionary timescale, the level of outcrossing has consequences. Since males of most C. elegans wild isolates retain the ability to mate (Hodgkin and Doniach, 1997), even if not very efficiently, the maintenance of genes required for male-specific development and behavior seems to imply the existence of outcrossing in the wild. On the other hand, C. elegans hermaphrodites produce much less male-attracting pheromone than females of other Caenorhabditis species, consistent with the fact that outcrossing is not required (Chasnov and Chow, 2002; Lipton et al., 2004).
Other theoretical consequences of a high degree of selfing are the rapid elimination of highly deleterious recessive mutations (because they are not masked in the heterozygous state when they appear) and on the other hand the accumulation of slightly deleterious mutations (“Müller's ratchet”). In addition to outcrossing, the rapid evolution of compensatory mutations (see below) could help to eliminate the phenotypic effect of deleterious mutations. The evolutionary feedback of phenotypes on genotypes becomes highly relevant at this point.
Phenotypic evolution is the product of two processes, 1. the effect of mutational and environmental change on the phenotype, followed by 2. the sorting of these phenotypes in the wild by selection and drift. As with DNA evolution, the effect of random mutation on the rate and pattern of phenotypic variation can then be compared with the actual natural diversity.
Any operational definition of fitness is only partial and may not include the most relevant parameters in the wild, which vary with ecological contexts. In the laboratory, a “fitness” parameter can be computed from measures of progeny number and generation time. This laboratory “fitness” decreases at a rate of about 0.1% per generation in mutation accumulation lines, which is slower than in Drosophila (Keightley and Caballero, 1997; Vassilieva and Lynch, 1999; Vassilieva et al., 2000; Figure 2). Knowing the fitness decrease the molecular mutation rate and the proportion of constrained nucleotides as estimated from a genome comparison with C. briggsae, it appears that most deleterious mutations that are eliminated in the wild cannot be detected in the laboratory, either because they have a very mild deleterious effect that would nevertheless be relevant in large populations or because they have a stronger effect in another environment (Davies et al., 1999; Denver et al., 2004; Estes et al., 2004).
Very strikingly, mutation accumulation lines recover remarkably rapidly when mutation and competition between resulting genotypes are allowed through a population expansion. This rapid recovery over 10-80 generations most likely occurs through compensatory extragenic mutations (Estes and Lynch, 2003). A population undergoing successive bottlenecks and expansions is thus able to recover despite the fixation of deleterious alleles by random drift during the bottlenecks.
Body size changes rapidly upon mutation of the N2 genome and most mutation accumulation lines show a decrease in body size compared to N2 (Figure 2), as also observed after EMS-mediated mutagenesis, systematic RNAi screens or artificial selection experiments (Azevedo et al., 2002). Thus, from a given genotype, some phenotypic changes are easier than others. Such patterns of spontaneous variation can then be taken into account when studying variations in natural populations (Dichtel-Danjoy and Félix, 2004).
Even though C. elegans is not very diverse at the molecular level, wild strains show phenotypic variation among them in laboratory conditions. Because of the paucity of ecological data, their relevance in the natural context is at this point poorly understood.
Note that the N2 strain has been maintained in the laboratory for years before being frozen and may not be the best representative of a natural C. elegans isolate. The Bergerac derivatives were useful when molecular polymorphisms were mostly detected by transposon-tagging, yet are not the current best choice, because their (sick) phenotypes may not be more representative of natural variation than those induced in the laboratory. Indeed, cultures have been maintained for over 20 years before freezing and show different phenotypes (Hodgkin and Doniach, 1997). More generally, any phenotype found in a single wild isolate may not be very relevant.
“Laboratory fitness” and a tradeoff between progeny number and generation time
Progeny number and generation time under standard laboratory conditions vary among wild isolates (Abdul Kader and Côté, 1996; Hodgkin and Doniach, 1997). The brood size of the selfing hermaphrodite corresponds to the number of sperm produced prior to the irreversible onset of oogenesis. This results in a tradeoff between sperm number and generation time: the more sperm produced, the longer the generation time (Hodgkin and Barnes, 1991; Abdul Kader and Côté, 1996; Cutter, 2004). It remains to be assessed whether these phenotypic measures are relevant in the wild; moreover, the selection pressures on brood size may vary with ecological conditions.
Many male-female species (including Caenorhabditis spp.) show an inbreeding depression when low-frequency recessive deleterious mutations are rendered homozygous by inbreeding, and conversely, hybrid vigor (heterosis) when two strains are crossed. At this day, such a phenomenon was not observed in F1 hybrids between N2 and Bergerac for growth rate, fertility or longevity (Johnson and Hutchinson, 1993). Conversely, it would be interesting to study whether the divergence of some isolated populations (for example on islands) may result in an “outbreeding depression” (partial speciation) if the genomes are artificially recombined.
Egg-laying: When well-fed, N2 hermaphrodites lay embryos at mid to late gastrulation, whereas many other isolates lay their eggs at an earlier stage (M.-A. Félix, unpublished).
Frequency of spontaneous males and male fertility (Hodgkin and Doniach, 1997).
Hermaphrodite and male longevity (McCulloch and Gems, 2003).
Body size: Many C. elegans strains are shorter than N2. The size variation between N2 and CB4855 has been mapped to chromosomes V and X (Abdul Kader and Côté, 1996; Hodgkin and Doniach, 1997).
Clumping, oxygen and ethanol sensation: Behavioral traits, such as the olfactory repertoire (Wicks et al., 2001; Stewart et al., 2004), are likely to be under diversifying selection pressures depending on ecological conditions.
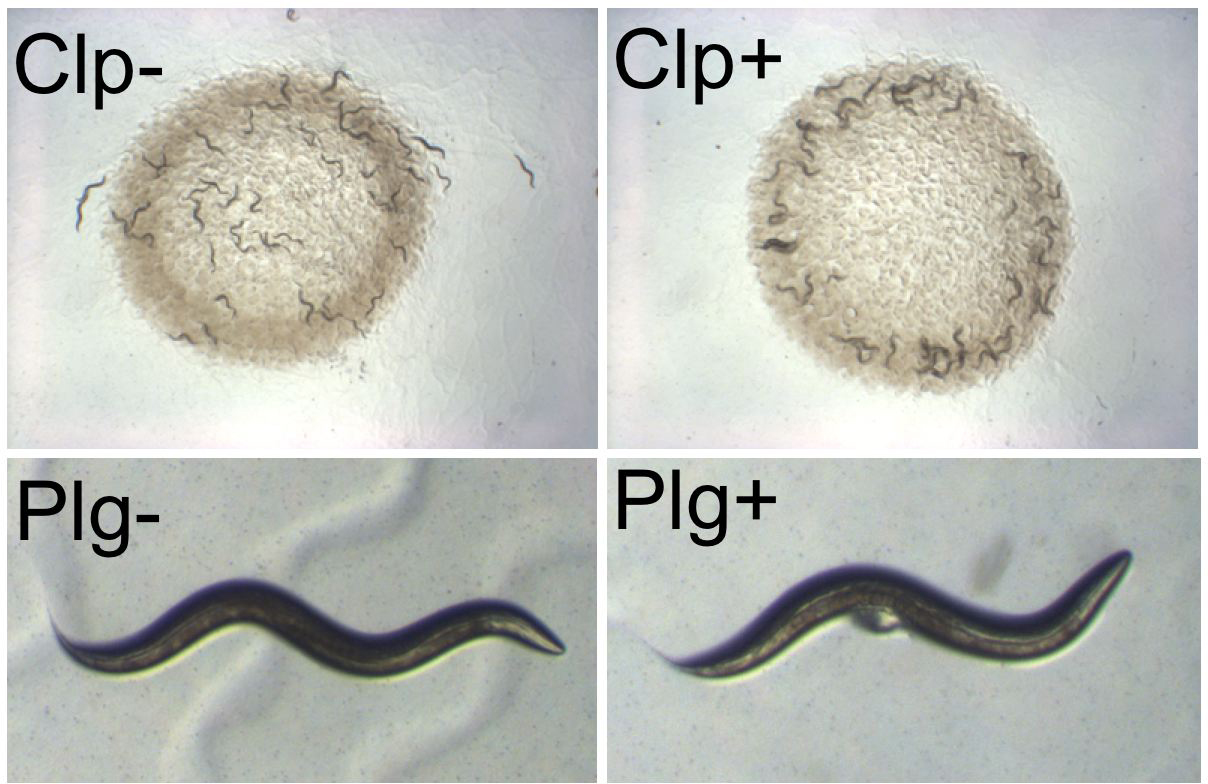
The best studied polymorphism in C. elegans concerns the Clumping and Bordering behaviors: in some C. elegans isolates such as CB4856, adults tend to aggregate on the border of the E. coli lawn of standard culture plates (whereas N2 adults aggregate once the plate is just starved; Hodgkin and Doniach, 1997; de Bono and Bargmann, 1998; Figure 5; see Aggregation). This phenotypic polymorphism is caused by a genetic polymorphism at a single locus, called npr-1, which encodes a neuropeptide Y receptor homolog. The solitary feeders such as N2 possess a form of the receptor with reduced activity, whereas the Clumpers have a dominant gain-of-function variation in the amino-acid sequence (de Bono and Bargmann, 1998). Other Caenorhabditis species carry the N2 form of the receptor (Rogers et al., 2003), although some clump, suggesting that the same phenotype may be obtained through variation at another locus (M. de Bono, pers. comm.). Most strikingly, the evolutionary change within C. elegans is a gain of function of the NPR-1 protein. The ecological relevance of the Clumping phenotype as seen in the laboratory is not clear at this point. It is likely that the effect is mediated by the lower oxygen levels at the border of the bacterial lawn and in a worm group (Gray et al., 2004). Variation in npr-1 also affects recovery of worms upon exposure to high ethanol levels (Davies et al., 2004).
RNAi and transposons: The Hawaiian strain CB4856 is partially resistant to RNAi inactivation of germ line-expressed genes, due to variation at one major locus, ppw-1, which encodes a PAZ/PIWI-domain-containing protein (Tijsterman et al., 2002; see RNAi mechanisms). CB4856 displays several molecular polymorphisms in the ppw-1 gene, including a one-base pair deletion that results in an early stop codon (Tijsterman et al., 2002). The phenotypic significance in the wild is unknown, but may be related to transposon activity.
Transposon number and/or activity in the germ line are elevated in some “mutator” wild strains compared to N2 (Anderson, 1995; Egilmez et al., 1995; see Transposons in C. elegans). Some of the chromosomal regions with high transposon number are retained in several wild strains, suggesting that they are not necessarily an evolutionary deadend.
Resistance to various environmental hazards: Resistance to a toxic environment is likely to be a fast-evolving and polymorphic character. For example, a population sampled in a South California desert shows an unusual resistance to high temperatures, apparently due to the balancing of one heterozygote locus (Hodgkin and Doniach, 1997). This natural population has unfortunately not be resampled since.
Pathogens are likely to be a major survival issue for C. elegans in the wild (see Interactions with microbial pathogens and Ecology of Caenorhabditis species). C. elegans strains differ in their response to the pathogenic bacterium Bacillus thuringiensis in terms of survival rate, infection levels, pumping rate and evasion behavior (Schulenburg and Muller, 2004). Resistance to the bacterium Serratia marcescens is found to be polymorphic within a local population of C. elegans and different strains of Serratia marcescens specifically affect different C. elegans strains (Schulenburg and Ewbank, 2004): it is possible that both species coevolve in an evolutionary arms race.
The cuticle composition varies between wild isolates of C. elegans, as can be detected by specific antibody staining. The variation maps at a locus called srf-1 (Politz et al., 1987) and a variant allele results in a weaker response to the cuticle-bound pathogenic bacterium Microbacterium nematophilum (Hodgkin et al., 2000).
Phenotypic variations in resistance to phenol-derived toxic compounds (Abdul Kader and Côté, 1996) and to the volatile anesthetic halothane (van Swinderen et al., 1997) have also been described.
Plugging. In many animal species, males leave a copulatory plug on the female's genitalia after mating, which is often thought to prevent remating. N2 males do not leave a plug, whereas males of several other wild isolates of C. elegans do (Hodgkin and Doniach, 1997; Figure 5). This plug does not fully prevent remating by another male, but makes it less probable (Barker, 1994); it is possible that the plug has other unknown consequences. Polymorphisms in Plugging are found within local populations (Barrière and Félix, 2005). The phenotypic polymorphism between N2 and several Plugging strains is the result of allelic variation at one major locus called plg-1, which is yet to be identified at the molecular level; the N2 phenotype is recessive (Hodgkin and Doniach, 1997).
Dauer entry and exit. Entry into the dauer stage and exit from it are key developmental decisions in the life of C. elegans (see Ecology of Caenorhabditis species). The sets of environmental cues that influence them and the doses at which they operate and interact with each other vary: for example, N2 is more sensitive to dauer pheromone than some other strains (Viney et al., 2003).
Development. One of the few non-invariant cell division patterns in N2 is that of P3.p, a ventral epidermal cell: in about half of the animals, it fuses to the hypodermal syncytium hyp7 in the L2 stage, whereas in the other half, it divides in the L3 stage and its daughters then fuse with hyp7 (Eisenmann et al., 1998; Sulston and Horvitz, 1977). This division frequency is polymorphic in C. elegans (5–60%) and varies even more within the Caenorhabditis genus (0–100%; Delattre and Félix, 2001; Delattre and Félix, 2001; Bonnaud et al., 2002).
In C. briggsae, the morphology of the male tail sensory rays varies within and among different strains: in the reference strain AF16, ray 3 is displaced posteriorly (compared with the C. elegans pattern) and rays 3 and 4 are fused in nearly all animals, whereas in some other strains of C. briggsae only about half of the males show ray 3–4 fusion (Baird, 2001).
Penetrance of mutations
When laboratory mutations are mapped using SNPs of the CB4856 strain, it is a frequent finding that the penetrance is greatly modified by the CB4856 background, which is usually bad news for the mapper, but demonstrates an underlying evolutionary change in relevant genes.
Phenotypic variation between two wild isolates may be due to variation at a single major locus, in which case it can be studied genetically like a laboratory mutant phenotype. It is then relatively easy to determine the nature of the gene and the type of alteration (cis-regulatory or protein change, loss or gain-of-function), as was done for the npr-1 locus.
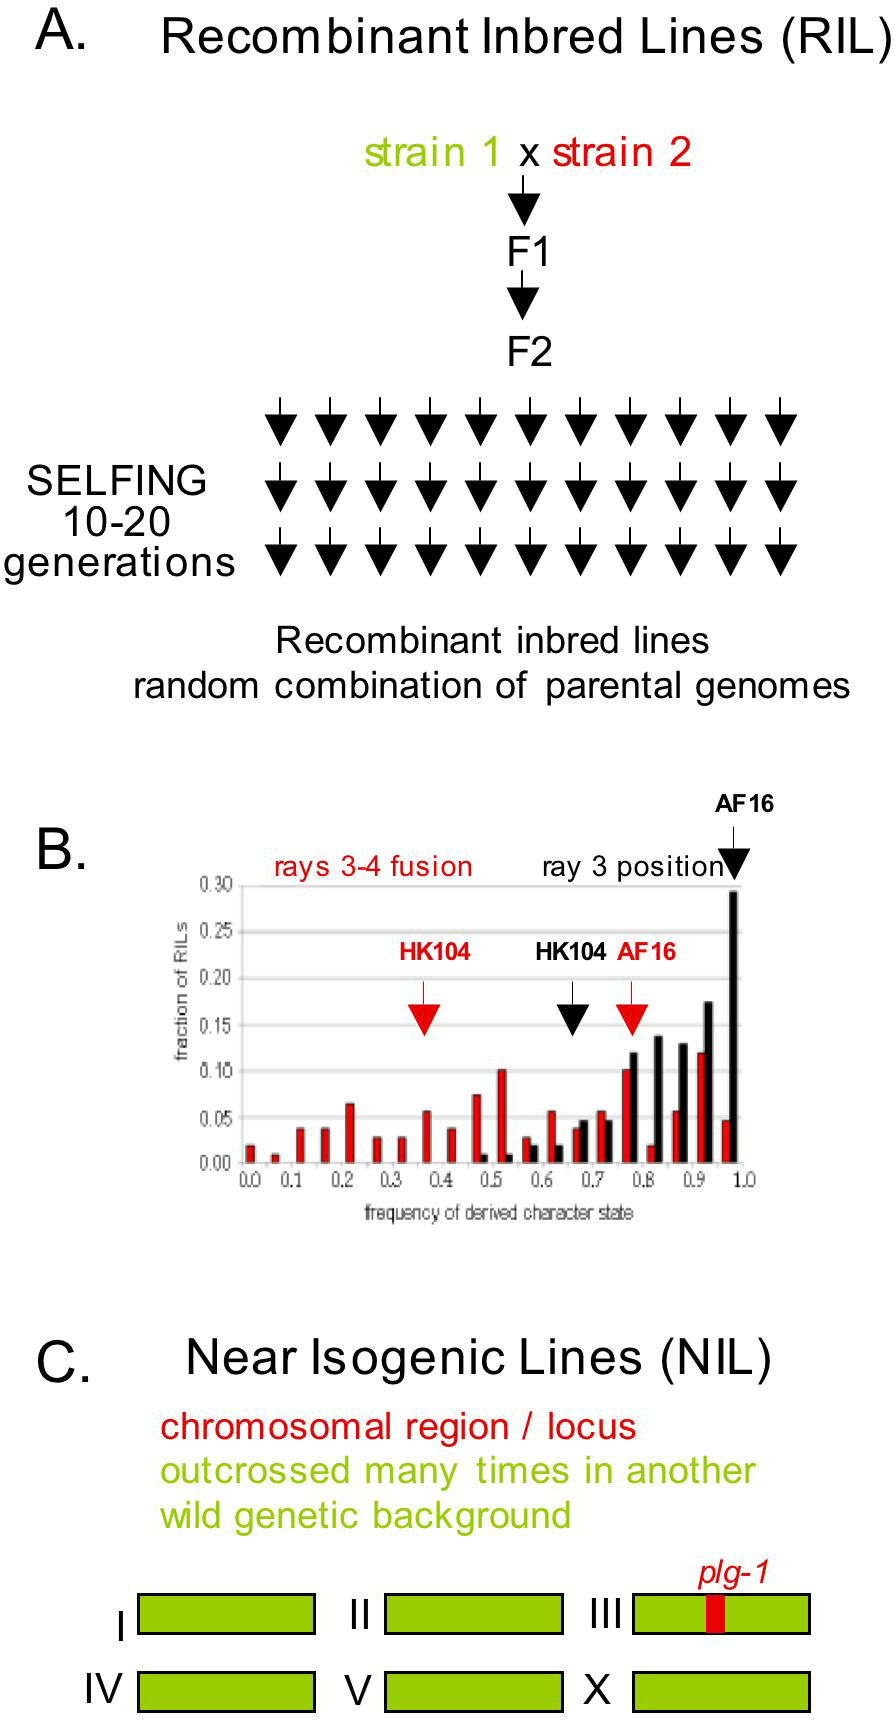
The phenotypic variation may however be due to genetic variation at more than one major locus. This can be deduced either from a phenotypic analysis of the F2s of a cross, or using Recombinant Inbred Lines (RIL; Figure 6). Each RI line has a random combination of the two parental genomes in the homozygous state - a great simplification compared to F2 analysis because it removes all heterozygous combinations and allows the study of frequency traits on an isogenic population. If the variation is monogenic, each parental phenotype will be found in half of the RI lines. Otherwise, the proportions may be altered, or intermediate or extreme phenotypes be found. With several loci, the different alleles may interact additively or epistatically. For example, the variation in P3.p division frequency between the N2 and CB4857 or that between the C. briggsae strains AF16 and HK104 in male ray position are the consequences of genetic variation at several loci (Bonnaud et al., 2002; Baird et al., 2005; Figure 6).
|
Figure 6. Recombinant inbred lines and near isogenic lines. A. A set of n Recombinant Inbred Lines (RIL) is produced by picking n individuals in the F2 generation of a cross between two wild isolates, and letting them self for 10–15 generations until the resulting strains are isogenic. RIL have been built between the reference strain N2 and a number of other wild isolates, including Bergerac (Johnson and Wood, 1982; Ebert et al., 1993; van Swinderen et al., 1997), CB4856 (S. Wicks and R. Plasterk; M. Hammarlund & E. Jorgensen, pers. comm.), DR1350 (Viney et al., 2003), CB4857 (Bonnaud et al., 2002), etc. B. Frequency distribution of male ray 3 position (black bars) and ray 3-4 fusion (red bars) among Recombinant Inbred Lines of the C. briggsae AF16 and HK104 strains (Baird et al., 2005). The phenotypes of the parental lines are indicated by arrows. The phenotypic variation is due to variation at several loci, with transgressive segregation. In addition, the only partial correlation of the two phenotypes between the different lines (not shown) show that they can evolve independently. C. A Near Isogenic Line is obtained by moving a chromosomal segment from one genetic background to another by repeated crosses, which can be assisted by flanking markers. For example, a Plugging plg-1(e2001)III strain in the N2 background was built in this manner (Hodgkin and Doniach, 1997).
Even if two wild isolates display a similar phenotype, the phenotype of some RI lines may lie outside the range of the phenotypic distribution of both parents. This so-called transgressive segregation indicates that alleles from both parents at different loci act in the same direction on the trait when combined (van Swinderen et al., 1997; Delattre and Félix, 2001) and thus indicates evolution in the molecular mechanisms that underlie the phenotype. For example, if the two parental isolates have similar phenotypes, some of the lines may show a distinct phenotype, thus revealing cryptic genetic variation.
The genetic structure of populations (see above) and the genetic architecture of a polymorphic trait bear on how a polymorphism appears, spreads and is maintained in wild populations. A polymorphism found in extant populations may be a transient quasi-neutral polymorphism (which may be maintained for a long time because of population isolation), a recent and currently spreading variant, or a polymorphism that is maintained because of selective advantages of both forms in specific ecological conditions.
Abdul Kader, N., and Côté, M. G. (1996). Isolement, identification et caractérisation de souches québécoises du nématode Caenorhabditis elegans. Fund. app. Nemat. 19, 381–389.
Anderson, P. (1995). Mutagenesis. In: Caenorhabditis elegans: modern biological analysis of an organism, H. F. Epstein, and D. C. Shakes, eds., San Diego, Academic Press, pp. 31–58.
Azevedo, R.B., Keightley, P.D., Lauren-Maatta, C., Vassilieva, L.L., Lynch, M., and Leroi, A.M. (2002). Spontaneous mutational variation for body size in Caenorhabditis elegans. Genetics 162, 755–765. Abstract
Baird, S.E. (2001). Strain-specific variation in the pattern of caudal papillae in Caenorhabditis briggsae (Nematoda: Rhabditidae); implications for species identification. Nematology 3, 373–376.
Baird, S.E., Davidson, C.R., and Bohrer, J.C. (2005). The genetics of ray pattern variation in Caenorhabditis briggsae. BMC Evol. Biol. 5, 3. Abstract Article
Barrière, A., and Félix, M.-A. (2005). High local genetic diversity and low outcrossing rate in Caenorhabditis elegans natural populations. Curr. Biol. 15, 1176–1184. Abstract Article
Barker, D.M. (1994). Copulatory plugs and paternity assurance in the nematode Caenorhabditis elegans. Anim. Behav. 48, 147–156.
Bonnaud, L., Delattre, M., and Félix, M.-A. (2002). Division and fate of vulval precursor cells: is polymorphism an image of interspecific divergence? Paper presented at: Fourth International Congress of Nematology, Tenerife, Spain, Brill, Leiden, The Netherlands.
Charlesworth, B., Charlesworth, D., and Barton, N.H. (2003). The effects of genetic and geographic structure on neutral variation. Ann. Rev. Ecol. Evol. Syst. 34, 99–125.
Chasnov, J.R., and Chow, K.L. (2002). Why are there males in the hermaphroditic species Caenorhabditis elegans? Genetics 160, 983–994. Abstract
Cutter, A.D. (2004). Sperm-limited fecundity in nematodes: how many sperm are enough? Evolution Int. J. Org. Evolution 58, 651–655. Abstract
Cutter, A.D., Aviles, L., and Ward, S. (2003). The proximate determinants of sex ratio in C. elegans populations. Genet. Res. 81, 91–102. Abstract
Davies, A.G., Bettinger, J.C., Thiele, T.R., Judy, M.E., and McIntire, S.L. (2004). Natural variation in the npr-1 gene modifies ethanol responses of wild strains of C. elegans. Neuron 42, 731–743. Abstract Article
Davies, E.K., Peters, A.D., and Keightley, P.D. (1999). High frequency of cryptic deleterious mutations in Caenorhabditis elegans. Science 285, 1748–1751. Abstract
de Bono, M., and Bargmann, C.I. (1998). Natural variation in a neuropeptide Y receptor homolog modifies social behavior and food response in C. elegans. Cell 94, 679–689. Abstract
Delattre, M., and Félix, M.A. (2001). Microevolutionary studies in nematodes: a beginning. Bioessays 23, 807–819. Abstract
Delattre, M., and Félix, M.A. (2001). Polymorphism and evolution of vulval precursor cell lineages within two nematode genera, Caenorhabditis and Oscheius. Curr. Biol. 11, 631–643. Abstract
Denver, D.R., Morris, K., Kewalramani, A., Harris, K.E., Chow, A., Estes, S., Lynch, M., and Thomas, W.K. (2004). Abundance, distribution, and mutation rates of homopolymeric nucleotide runs in the genome of Caenorhabditis elegans. J. Mol. Evol. 58, 584–595. Abstract Article
Denver, D.R., Morris, K., Lynch, M., and Thomas, W.K. (2004). High mutation rate and predominance of insertions in the Caenorhabditis elegans nuclear genome. Nature 430, 679–682. Abstract Article
Denver, D.R., Morris, K., Lynch, M., Vassilieva, L.L., and Thomas, W.K. (2000). High direct estimate of the mutation rate in the mitochondrial genome of Caenorhabditis elegans. Science 289, 2342–2344. Abstract
Denver, D.R., Morris, K., and Thomas, W.K. (2003). Phylogenetics in Caenorhabditis elegans: an analysis of divergence and outcrossing. Mol. Biol. Evol. 20, 393–400. Abstract
Dichtel-Danjoy, M.L., and Félix, M.A. (2004). Phenotypic neighborhood and micro-evolvability. Trends Genet. 20, 268–276. Abstract Article
Ebert, R.H., 2nd, Cherkasova, V.A., Dennis, R.A., Wu, J.H., Ruggles, S., Perrin, T.E., and Shmookler Reis, R.J. (1993). Longevity-determining genes in Caenorhabditis elegans: chromosomal mapping of multiple noninteractive loci. Genetics 135, 1003–1010. Abstract
Egilmez, N.K., Ebert, R.H., 2nd, and Shmookler Reis, R.J. (1995). Strain evolution in Caenorhabditis elegans: transposable elements as markers of interstrain evolutionary history. J. Mol. Evol. 40, 372–381. Abstract
Eisenmann, D.M., Maloof, J.N., Simske, J.S., Kenyon, C., and Kim, S.K. (1998). The beta-catenin homolog BAR-1 and LET-60 Ras coordinately regulate the Hox gene lin-39 during Caenorhabditis elegans vulval development. Development 125, 3667–3680. Abstract
Estes, S., and Lynch, M. (2003). Rapid fitness recovery in mutationally degraded lines of Caenorhabditis elegans. Evolution 57, 1022–1030.
Estes, S., Phillips, P.C., Denver, D.R., Thomas, W.K., and Lynch, M. (2004). Mutation accumulation in populations of varying size: the distribution of mutational effects for fitness correlates in Caenorhabditis elegans. Genetics 166, 1269–1279. Abstract
Frisse, L. (1999) Understanding the Mechanisms of Microsatellite Formation and Mutation using the Model Organism Caenorhabditis elegans, Ph.D. thesis, University of Missouri, Kansas City.
Graustein, A., Gaspar, J.M., Walters, J.R., and Palopoli, M.F. (2002). Levels of DNA polymorphism vary with mating system in the nematode genus Caenorhabditis. Genetics 161, 99–107. Abstract
Gray, J.M., Karow, D.S., Lu, H., Chang, A.J., Chang, J.S., Ellis, R.E., Marletta, M.A., and Bargmann, C.I. (2004). Oxygen sensation and social feeding mediated by a C. elegans guanylate cyclase homologue. Nature 430, 317–322. Abstract Article
Haber, M., Schungel, M., Putz, A., Muller, S., Hasert, B., and Schulenburg, H. (2005). Evolutionary History of Caenorhabditis elegans Inferred from Microsatellites: evidence for spatial and temporal genetic differentiation and the occurrence of outbreeding. Mol. Biol. Evol. 22, 160–173. Abstract Article
Hartl, D.L., and Clark, A.G. (1997). Principles of Population Genetics (3rd edition) Sunderland, MA, Sinauer Associates, Inc.
Hodgkin, J. (1983). Male phenotypes and mating efficiency in Caenorhabditis elegans. Genetics 103, 43–64.
Hodgkin, J., and Barnes, T.M. (1991). More is not better: brood size and population growth in a self-fertilizing nematode. Proc. R. Soc. Lond. B Biol. Sci. 246, 19–24. Abstract
Hodgkin, J., and Doniach, T. (1997). Natural variation and copulatory plug formation in Caenorhabditis elegans. Genetics 146, 149–164. Abstract
Hodgkin, J., Kuwabara, P.E., and Corneliussen, B. (2000). A novel bacterial pathogen, Microbacterium nematophilum, induces morphological change in the nematode C. elegans. Curr. Biol. 10, 1615–1618. Abstract
Hudson, R.R., and Kaplan, N.L. (1985). Statistical properties of the number of recombination events in the history of a sample of DNA sequences. Genetics 111, 147–164. Abstract
Johnson, T.E., and Hutchinson, E.W. (1993). Absence of strong heterosis for life span and other life history traits in Caenorhabditis elegans. Genetics 134, 465–474. Abstract
Johnson, T.E., and Wood, W.B. (1982). Genetic analysis of life-span in Caenorhabditis elegans. Proc. Natl. Acad. Sci. 79, 6603–6607.
Jovelin, R., Ajie, B.C., and Phillips, P.C. (2003). Molecular evolution and quantitative variation for chemosensory behaviour in the nematode genus Caenorhabditis. Mol. Ecol. 12, 1325–1337. Abstract
Keightley, P.D., and Caballero, A. (1997). Genomic mutation rates for lifetime reproductive output and lifespan in Caenorhabditis elegans. Proc. Natl. Acad. Sci. USA 94, 3823–3827. Abstract
Kiontke, K., Gavin, N.P., Raynes, Y., Roehrig, C., Piano, F., and Fitch, D.H. (2004). Caenorhabditis phylogeny predicts convergence of hermaphroditism and extensive intron loss. Proc. Natl. Acad. Sci. USA 101, 9003–9008. Abstract Article
Koch, R., van Luenen, H.G., van der Horst, M., Thijssen, K.L., and Plasterk, R.H. (2000). Single nucleotide polymorphisms in wild isolates of Caenorhabditis elegans. Genome Res. 10, 1690–1696. Abstract
LaMunyon, C.W., and Ward, S. (1995). Sperm precedence in a hermaphroditic nematode (Caenorhabditis elegans) is due to competitive superiority of male sperm. Experientia 51, 817–823. Abstract
LaMunyon, C.W., and Ward, S. (1997). Increased competitiveness of nematode sperm bearing the male X chromosome. Proc. Natl. Acad. Sci. USA 94, 185–189. Abstract
Lipton, J., Kleemann, G., Ghosh, R., Lints, R., and Emmons, S.W. (2004). Mate searching in Caenorhabditis elegans: a genetic model for sex drive in a simple invertebrate. J. Neurosci. 24, 7427–7434. Abstract Article
Maupas, E. (1900). Modes et formes de reproduction des nématodes. Arch. Zool. exp. 8, 463–624. Article
McCulloch, D., and Gems, D. (2003). Evolution of male longevity bias in nematodes. Aging Cell 2, 165–173. Abstract
Nigon, V. (1949). Modalités de la reproduction et déterminisme du sexe chez quelques nématodes libres. Ann. des. Sc. Nat. Zool. 11, 1–132.
Politz, S.M., Chin, K.J., and Herman, D.L. (1987). Genetic analysis of adult-specific surface antigenic differences between varieties of the nematode Caenorhabditis elegans. Genetics 117, 467–476. Abstract
Rogers, C., Reale, V., Kim, K., Chatwin, H., Li, C., Evans, P., and de Bono, M. (2003). Inhibition of Caenorhabditis elegans social feeding by FMRFamide-related peptide activation of NPR-1. Nat. Neurosci. 6, 1178–1185. Abstract Article
Schulenburg, H., and Ewbank, J.J. (2004). Diversity and specificity in the interaction between Caenorhabditis elegans and the pathogen Serratia marcescens. BMC Evol. Biol. 4, 49. Abstract Article
Schulenburg, H., and Muller, S. (2004). Natural variation in the response of Caenorhabditis elegans towards Bacillus thuringiensis. Parasitology 128, 433–443. Abstract
Shabalina, S.A., and Kondrashov, A.S. (1999). Pattern of selective constraint in C. elegans and C. briggsae genomes. Genet. Res. 74, 23–30. Abstract
Sivasundar, A., and Hey, J. (2003). Population genetics of Caenorhabditis elegans: the paradox of low polymorphism in a widespread species. Genetics 163, 147–157. Abstract
Sivasundar, A., and Hey, J. (2005). Sampling from natural populations with RNAi reveals high outcrossing and population structure in Caenorhabditis elegans. Curr. Biol. 15, 1598–1602. Abstract Article
Srinivasan, J., Pires-daSilva, A., Gutierrez, A., Zheng, M., Jungblut, B., Witte, H., Schlak, I., and Sommer, R.J. (2001). Microevolutionary analysis of the nematode genus Pristionchus suggests a recent evolution of redundant developmental mechanisms during vulva formation. Evol. Dev. 3, 229–240. Abstract
Stein, L.D., Bao, Z., Blasiar, D., Blumenthal, T., Brent, M.R., Chen, N., Chinwalla, A., Clarke, L., Clee, C., Coghlan, A., Coulson, A., D'Eustachio, P., Fitch, D.H.A., Fulton, L.A., Fulton, R.E., Griffiths-Jone, S., Harris, T.W., Hillier, L.W., Kamath, R., Kuwabara, P., Mardis, E.R., Marra, M.A., Miner, T.L., Minx, P., Mullikin, J.C., Plumb, R.W., Rogers, J., Schein, J.E., Sohrmann, M., Spieth, R., Stajich, J.E., Wei, C., Willey, D., Wilson, R.K., Dubin, R., and Waterston, R.H. (2003). The genome sequence of Caenorhabditis briggsae: a platform for comparative genomics. PLOS Biology 1, 166–192. Abstract
Stewart, A.D., and Phillips, P.C. (2002). Selection and maintenance of androdioecy in Caenorhabditis elegans. Genetics 160, 975–982. Abstract
Stewart, M.K., Clark, N.L., Merrihew, G., Galloway, E.M., and Thomas, J.H. (2004). High Genetic Diversity in the Chemoreceptor Superfamily of C. elegans. Genetics. Abstract Article
Sulston, J., and Horvitz, H.R. (1977). Postembryonic cell lineages of the nematode Caenorhabditis elegans. Dev. Biol. 56, 110–156.
Swan, K.A., Curtis, D.E., McKusick, K.B., Voinov, A.V., Mapa, F.A., and Cancilla, M.R. (2002). High-throughput gene mapping in Caenorhabditis elegans. Genome Res. 12, 1100–1105. Abstract Article
Thomas, W.K., and Wilson, A.C. (1991). Mode and tempo of molecular evolution in the nematode Caenorhabditis: cytochrome oxidase II and calmodulin sequences. Genetics 128, 269–279. Abstract
Tijsterman, M., Okihara, K.L., Thijssen, K., and Plasterk, R.H. (2002). PPW-1, a PAZ/PIWI protein required for efficient germline RNAi, is defective in a natural isolate of C. elegans. Curr. Biol. 12, 1535–1540. Abstract
van Swinderen, B., Shook, D.R., Ebert, R.H., Cherkasova, V.A., Johnson, T.E., Shmookler Reis, R.J., and Crowder, C.M. (1997). Quantitative trait loci controlling halothane sensitivity in Caenorhabditis elegans. Proc. Natl. Acad. Sci. USA 94, 8232–8237. Abstract
Vassilieva, L.L., Hook, A.M., and Lynch, M. (2000). The fitness effects of spontaneous mutations in Caenorhabditis elegans. Evolution Int. J. Org. Evolution 54, 1234–1246. Abstract
Vassilieva, L.L., and Lynch, M. (1999). The rate of spontaneous mutation for life-history traits in Caenorhabditis elegans. Genetics 151, 119–129. Abstract
Viney, M.E., Gardner, M.P., and Jackson, J.A. (2003). Variation in Caenorhabditis elegans dauer larva formation. Dev. Growth Differ. 45, 389–396. Abstract
*Edited by David H.A. Fitch. Last revised May 24, 2005. Published December 26, 2005. This chapter should be cited as: Barrière, A. and Félix, M.-A. Natural variation and population genetics of Caenorhabditis elegans (December 26, 2005), WormBook, ed. The C. elegans Research Community, WormBook, doi/10.1895/wormbook.1.43.1, http://www.wormbook.org.
Copyright: © 2005 Antoine Barrière and Marie-Anne Félix, This is an open-access article distributed under the terms of the Creative Commons Attribution License, which permits unrestricted use, distribution, and reproduction in any medium, provided the original author and source are credited.
§To whom correspondence should be addressed. E-mail: felix@ijm.jussieu.fr.
 All journal content, except where otherwise noted, is licensed under a Creative Commons Attribution License.