 Embryo series courtesy of Einhard Schierenberg
Table of Contents
Although C. elegans is primarily touted for its facile genetics, there has been a burgeoning interest in studying cell biological processes in this organism. Strong genetics (Brenner, 1974; Jorgensen and Mango, 2002), the development of fluorescent protein tags (Chalfie et al., 1994; Yang et al., 1996; Zhang et al., 2004), the availability of RNA interference strategies to disrupt gene function (Fire et al., 1998; Timmons and Fire, 1998), and the ability to perform studies on primary cultures of embryonic cells (Christensen et al., 2002; Zhang et al., 2002), have all led to an increase in the number of cell biological problems addressed in the worm. Furthermore, the transparency of the organism affords a unique opportunity to study the roles of cell biological processes in a living multicellular animal.
A serious obstacle to studying cell biological phenomena in C. elegans is the small size of its cells. However, advances in imaging techniques have allowed faint signals to be significantly amplified, and small structures to be visualized, allowing examination of transport, export, and import processes, as well as examination of cytoskeletal and chromatin structure.
Here we have compiled a set of protocols that broadly fit under the category of Cell Biology. We begin with a brief discussion of various microscopical techniques employed by C. elegans researchers to study aspects of the cell. We then describe methods for studying protein-protein and protein-DNA interactions in C. elegans. We also describe methods used to study specific cell biological problems (e.g. endocytosis, chromatin, programmed cell death). Finally, we conclude this chapter with a discussion of primary embryonic cell culture and its uses.
Contributors of sections or protocols are acknowledged in parentheses following the section or protocol titles. In some cases, protocols are based on previously published work, which is then cited after the protocol title. The on-line format of this chapter should easily allow for revisions and additions to the protocols presented here. Researchers willing to share protocols not presented here or with comments on existing protocols are encouraged to submit these to shaham@rockefeller.edu.
To study objects we must interact with them. Generally, the technique of interaction is determined by the size of the object. Thus, an object of macroscopic size can be studied by direct contact. However, microscopic objects, such as the cell and its organelles, must be studied with agents of similar or smaller size. Cells in C. elegans are roughly 3–30 microns in diameter, thus, light with wavelength in the visible range (~500 nm) is an ideal interacting agent. The set up of light microscopes affords a resolution that is about half the wavelength of light employed. Thus, light microscopy is useful for examining cells and cellular substructures on the order of 200–300 nm or larger. However, vesicles (often 50 nm in diameter), and other objects of similar or smaller scale cannot be resolved using current setups. Although, in principle, light of very short wavelength (e.g. X-rays) could be used to resolve smaller cellular structures, such light is too energetic, damaging the cell upon contact. In addition, lenses to focus high energy photons do not exist. High resolution can be obtained using electron microscopy. Moving electrons in an electron microscope possess wavelengths on the order of 0.3 nm. Using an electron microscope, the electrons can be used to form resolved images of cellular structures of about 3 nm in size.
Visible light can be used to examine C. elegans, however, in general, bright field and phase-contrast microscopy offers little contrast- making cells and their major components difficult to see. DIC microscopy, however, allows high contrast images to be formed, and is ideal for examining nuclei, nucleoli, and granular structures within C. elegans cells (Sulston and Horvitz, 1977; Sulston et al., 1983). In DIC microscopy light passes through a plane polarizer. The resulting polarized light is split into two components using a prism. These components interact with the sample, and are combined above the objective using a second prism. Finally, the transmitted light passes through an analyzer (essentially a polarizer that is polarized at 90 degrees with respect to the original plane of polarization) and on to the observer. The interaction of polarized light with the sample changes its plane of polarization. Thus, only light whose polarization is changed by the sample will be detected by the observer. In this way, highly contrasted images are formed. It should be remembered that shadowing effects seen using DIC microscopy do not reflect three-dimensional features of the sample. Rather, they reflect the ability of the specimen to interact with polarized light. Current microscopes allow the use of a 100X objective with DIC, giving high magnification and resolution. Some microscopes are equipped with additional lenses, however, these do not afford better resolution.
A protocol for mounting C. elegans for observation using DIC microscopy is presented below. This protocol can be used to mount animals for all microscopic techniques utilizing a compound microscope.
Protocol 1: Mounting animals for observation with DIC optics (Monica Driscoll)
1. Preparation of Agar Pads:
a. Materials
5% agar solution in water, melted and kept molten by placing the tube in a heat block at 65°C
Pasteur pipette and bulb
2 glass slides with pieces of labeling tape (for example, Fisher #11-880-5-D) taped over both ends to serve as spacers
2 clean glass slides
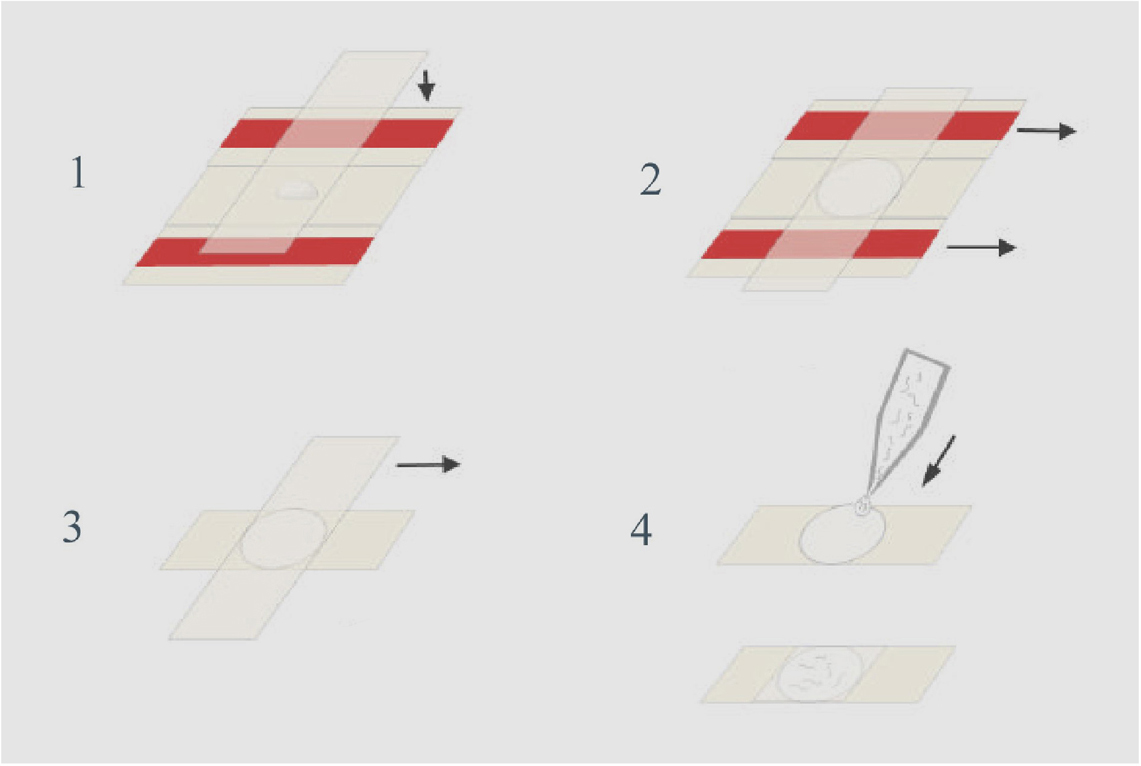
b. Preparation of Pads (See Figure 1):
Place the two taped slides with a clean slide sandwiched between them on a flat surface. Using the Pasteur pipette, place a drop of agar onto the clean slide. Cover the agar with another clean slide placed on top of the three slides in a perpendicular fashion. Press gently so the agar drop is flattened to a circle about 0.4 mm thick (the thickness of the tape spacers). Avoid getting bubbles in the agar since worms will get stuck in them. After the agar solidifies, gently pull out the taped slides, then separate the remaining two slides by sliding one relative to the other. The agar pad should adhere to one of the slides (usually the bottom one). Rest the slide, agar side up, on the bench top.
Note: The agar pad should be prepared just before use so that it does not dry out. Alternatively, once you pull out the taped slides, you can wrap the cross shaped slide-agar-slide in a piece of Saran wrap. This way you can keep the pad moist for a couple of hours.
2. Mounting Live Animals:
Place a 1–2 ul drop of M9 containing 10–25 mM sodium azide (NaN3) onto the center of the agar pad. NaN3 anesthetizes the worms so that they will not move. The agar pad can also be prepared with anaesthetic included for a final concentration of 2–10 mM NaN3 in the agar, instead of in the drop. This generally results in faster anesthetic action. If live worms are needed, NaN3 can be omitted and bacteria can be added to the drop to allow the worms to feed with little motion.
Transfer animals to be observed into the drop. Animals can be transferred using a worm pick or an eyebrow hair fastened to a toothpick with wood glue or clear nail polish. When the hair or pick is moved into the drop, animals float off easily. Alternatively, animals can be spun down in M9 in an eppendorf tube at 1200–1500 rpm with slow acceleration/deceleration. After the supernatant is discarded, the animals are suspended in 10 ul M9-NaN3. 2–3 ul of the solution with the animals can then be transferred to the pad.
Gently lay a coverslip over the animals. Most animals will lie on their left or right sides. Embryos also generally assume stereotypic orientations on agar pads. Between the 4-cell stage and 100–150 minutes the embryos display either the left or right sides. At gastrulation (150 min) they turn from left to dorsal or from right to ventral. At 350–400 minutes they return to display left or right sides (Sulston et al., 1983).
Animals will stop moving within a minute or two. Animals in sodium azide can recover following incubation in sodium azide of one-hour or less.
Polarized light can be used to examine repeated or crystalline structures. In a manner similar to DIC, plane polarized light that passes through a specimen will interact with the specimen and change its plane of polarization, allowing light to be detected through an analyzer located above the specimen and oriented at 90 degrees to the initial plane of polarization (for a more complete description see http://www.microscopyu.com/articles/polarized/ polarizedintro.html).
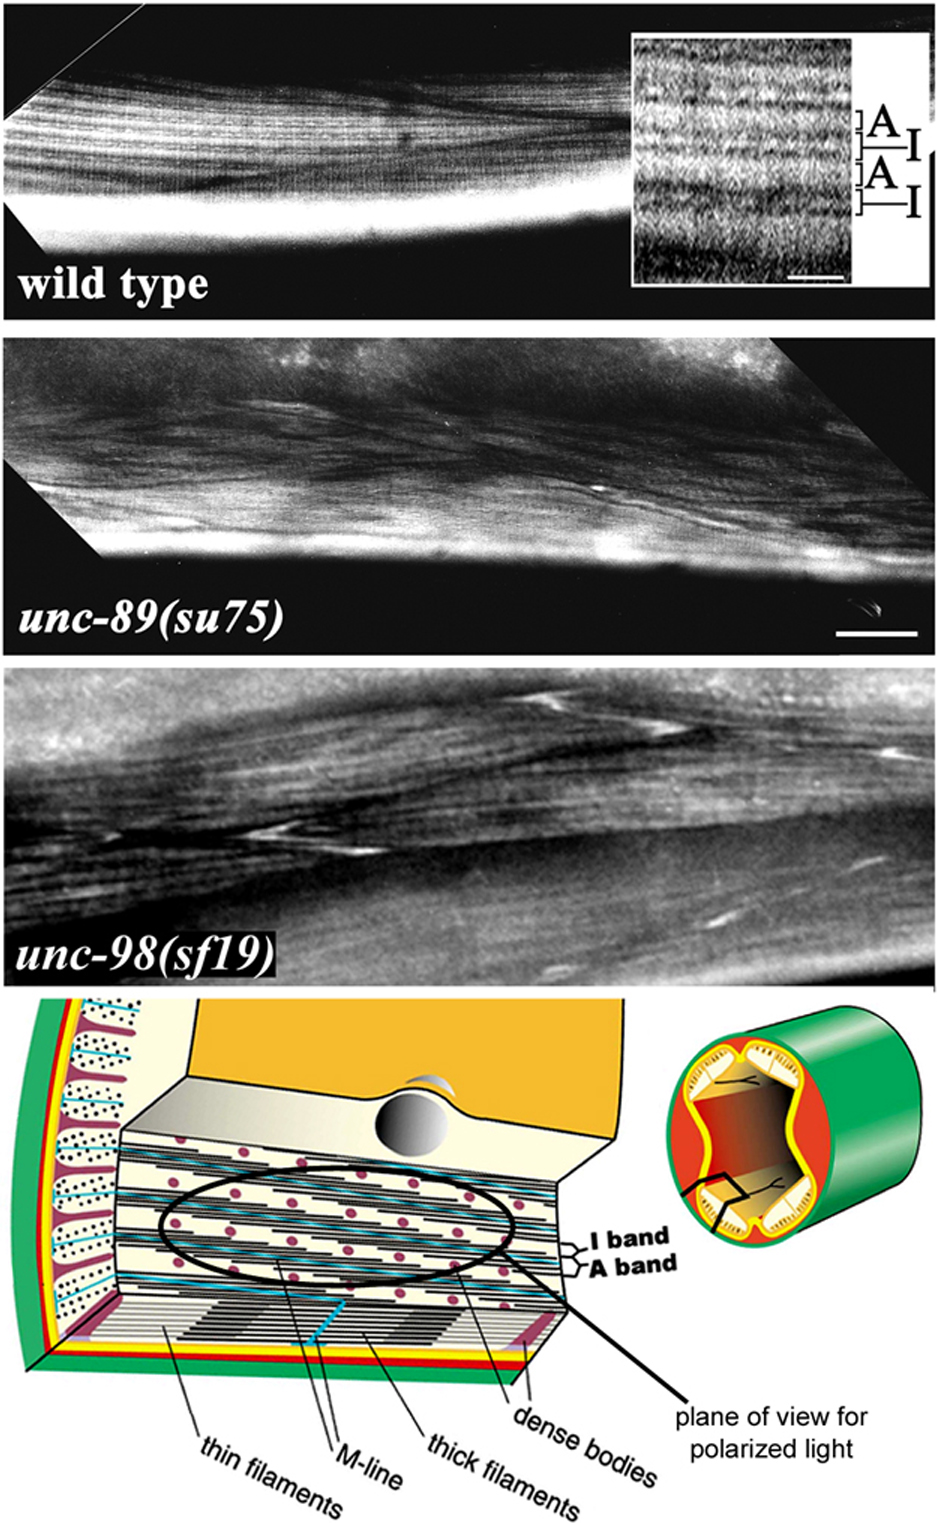
The muscles used for locomotion in C. elegans reside in the body wall. In the adult, there are 95 spindle shaped cells divided among four quadrants just underlying a basement membrane, hypodermis and cuticle. In each quadrant, the cells are arranged in interlocking pairs. In these muscle cells, myofilaments form a lattice that is restricted to a narrow zone of ~1.5 microns, just underlying the basement membrane and hypodermis. By polarized light microscopy, obvious striations are seen; bright (“birefringent”) A-bands alternate with dark I-bands; each I-band contains a row of dense bodies, which are the analogs of Z-discs of vertebrate striated muscle (Figure 2). Because the striations lie at a slightly oblique angle with respect to the long axis of the worm, this muscle is called “obliquely striated”. Polarized light is also useful for evaluating the second largest set of muscles, those in the pharynx. Below we present a protocol for observing C. elegans muscle using polarized light.
|
Figure 2. The top three panels show polarized light microscopy of adult body wall muscle from wild type and from two muscle-affecting mutants. Each image was captured with a 40X objective and shows portions of about three muscle cells. The inset shows an enlarged view. Wild type muscle shows a high degree of organization with birefringent A-bands alternating with dark I-bands, each containing a row of dense bodies. unc-89(su75) exhibits the phenotype of a typical unc-89 mutant: reduced organization of the myofilament lattice with an almost “basketweave” pattern. unc-98(sf19) displays disorganized myofibrils with characteristic birefringent “needles” at the ends of the muscle cells. The bottom panel is an illustration showing the position of the four muscle quadrants (right) and a portion of a single muscle cell emphasizing the myofilament lattice. The oval indicates the plane of view seen by polarized light (Denise Flaherty and Guy Benian).
Cellular structures and components can be labeled with a variety of fluorescent dyes that can be visualized using a fluorescence microscope. In response to incident light of specified wavelength (produced by a laser or using appropriate filters), fluorescent dye molecules are excited. Decay of the molecule from the excited state to an intermediate excited state produces a photon of a wavelength longer than that of the excitation source, which can easily be detected and separated, using appropriate filters, from the incident light (for a more detailed description see http://www.microscopyu.com/articles/fluorescence/fluorescenceintro.html). Below are a number of protocols for using dyes to visualize DNA, proteins and cellular structures. Dyes coupled to antibodies are particularly useful for visualizing the presence and localization of specific proteins within the cell, and several methods for antibody staining are discussed in the chapter on gene expression. Often it is of interest to study whether two cellular molecules physically interact. Fluorescence resonance energy transfer (FRET) has been used to indicate the proximity of two labeled fluorophores. However, this method has not been significantly used in C. elegans to date.
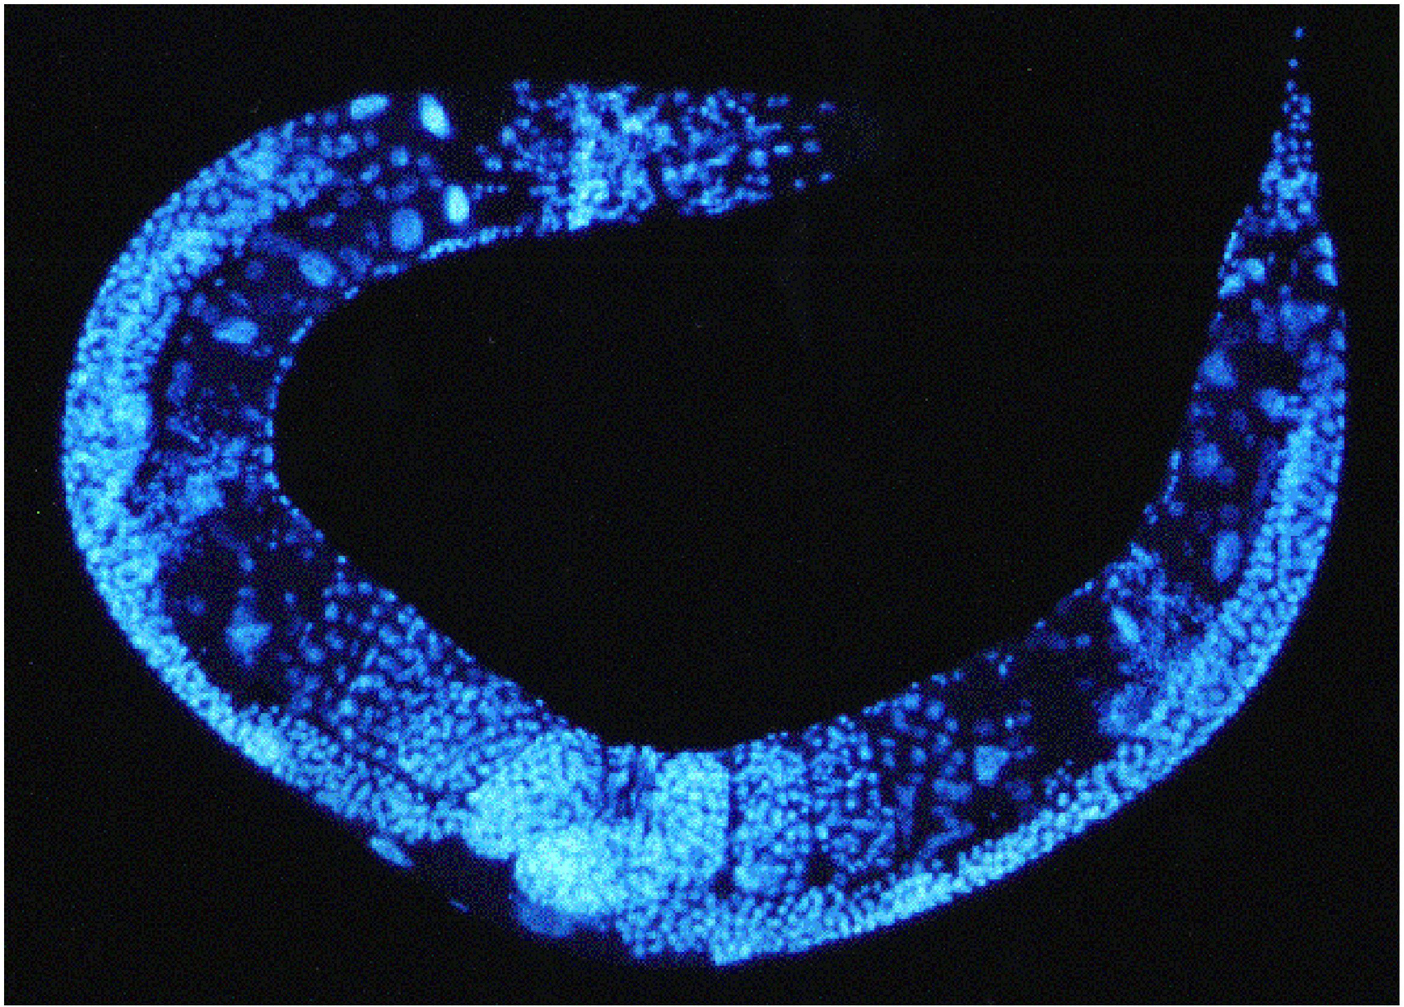
A number of fluorescent dyes can be used to visualize DNA in fixed animals. 4',6'-diamidino-2-phenylindole hydrochloride (DAPI), is by far the most commonly used DNA dye in C. elegans (Figure 3).
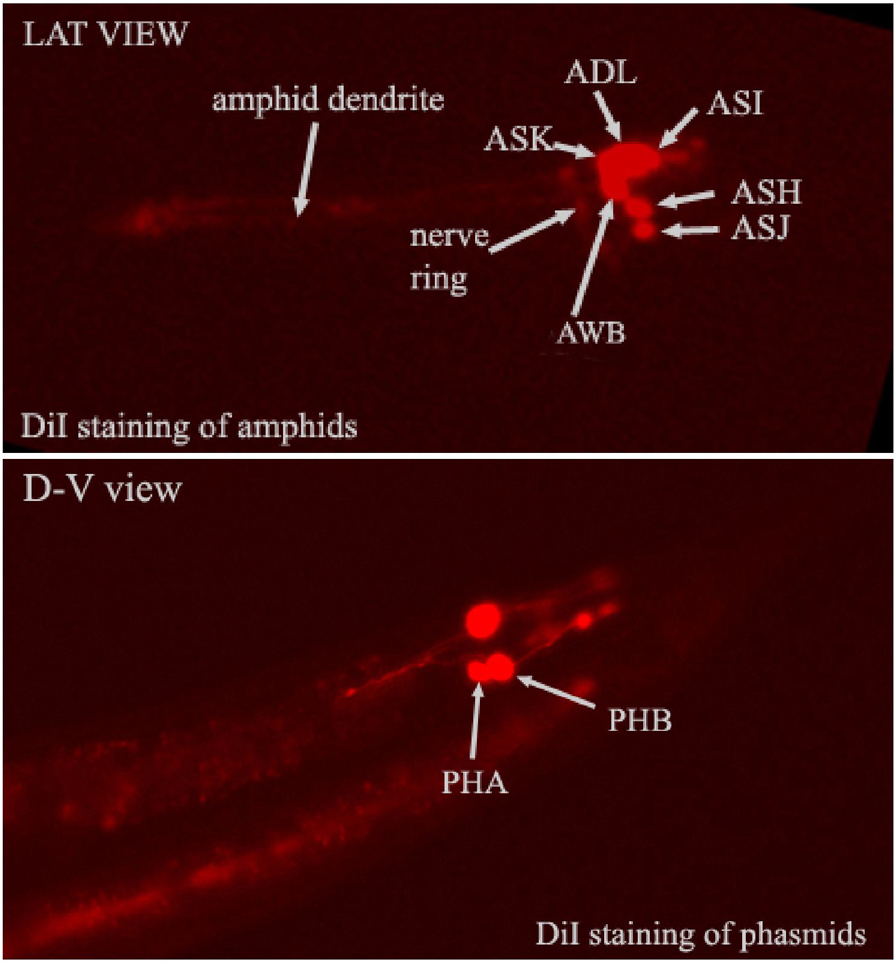
Amphid and phasmid neurons can take up lipophilic dyes from the environment (Hedgecock et al., 1985; Perkins et al., 1986). These dyes will label all parts of the neuron. The mechanism of dye uptake is unclear, but seems to correlate with some aspect of neuronal function. Thus, these dyes can be used to visualize neurons and perhaps to study their physiology (Figure 4). The dye fluorescein isothiocyanate (FITC) can be used to label the ADF, ASH, ASI, ASJ, ASK, and ADL cells of the amphid sensilla, and the PHA and PHB neurons of the phasmid sensillum. DiI, DiO, and DiD (Molecular Probes) can be used to visualize the ASI, ADL, ASK, AWB, ASH, and ASJ amphid neurons, as well as the PHA and PHB phasmid neurons (Collet et al., 1998).
Filamentous actin can be readily observed in C. elegans muscle by staining with fluorescin-conjugated phalloidin (Strome, 1986). Other actin structures can also be visualized using this method, however, Protocol 7, below, should be used.
The use of fluorescent proteins to tag cellular proteins has revolutionized cell biology (Zhang et al., 2002). In C. elegans, green fluorescent protein (GFP) and its derivatives, and more recently DsRed, have been employed to visualize protein localization, movement, and conformational changes in vivo (Chalfie et al., 1994; Miyawaki, 2002). Fusions to any protein can be generated using sets of vectors constructed by Andy Fire and others (Miller et al., 1999). In addition, labeling of specific organelles can be accomplished using pre-made vectors containing GFP fused to specific subcellular targeting sequences. Localization signals that are frequently used include those for the nucleus, mitochondria, and plasma membrane. Details regarding fluorescent proteins can be found in the gene expression chapter.
Examining protein localization using GFP or DsRed fusion proteins requires injection of corresponding transgenes into animals. Thus, a number of caveats exist in interpreting results from such experiments. For example, expression from transgene arrays is often higher than from the endogenous locus. Furthermore, fluorescent proteins are fairly bulky, thus, fusion proteins may not display appropriate localization. In addition, promoter elements used to drive expression of GFP transgenes are often expressed in cells where the endogenous protein is normally not made, or vice versa.
Fluorescently-labelled antibodies generated against a protein of choice allow direct examination of endogenous unmodified proteins, giving a clearer assessment of where endogenous expression is localized. Antibodies coupled to gold particles can also be used for electron microscopy to examine subcellular localization in great detail. Antibodies can only label fixed tissues, thus, they cannot be used for real time observation of protein localization dynamics. In addition, fixation often destroys cellular structure, limiting the resolution obtained by immunostaining. Detailed protocols for use of antibodies can be found in the gene expression chapter.
A number of microscopes are now commercially available for generating and examining fluorescent signals. All are able to resolve fluorescent entities both in space and in time. Differences among these microscopes center on spatial and temporal resolving power.
This binocular microscope allows visualization of highly expressed fluorescent signals at low magnification. The major use of the instrument is to visualize GFP and DsRed-labelled proteins in living worms on the surface of standard agar plates. Generally, use of this microscope allows selection of animals expressing a fusion protein of interest, as well as examination of very coarse cellular features (e.g. presence or absence of a neuronal process) for genetic screens (see for example Shaham and Bargmann, 2002). This method does not allow fine structure to be examined. The microscope consists of a standard binocular dissecting microscope equipped with epifluorescence.
This microscope has significantly higher resolution and magnification compared to the dissecting fluorescence microscope, and observation can be combined with DIC (Figure 5). Objectives of 100X are often used, and allow examination of gross subcellular localization of proteins. Images collected from such a microscope at high magnification suffer from an extensive background of fluorescent light emitted by cells not in the plane of focus and of scattered light. This often severely cuts down on the resolving power of this microscope. However, for first pass examination of samples, or for examining highly localized signals, this microscope is often the instrument of choice (for a more detailed description see http://www.microscopyu.com/articles/fluorescence/fluorescenceintro.html).
This instrument is essentially a compound fluorescence microscope equipped with a sensitive light detection system. Light collected from optical sections through the sample is processed using sophisticated computer software, which assigns out-of-focus light to its correct focal plane (Wallace et al., 2001). Images generated by this microscope consist of optical sections through a sample, and allow 3-dimensional reconstruction of the fluorescent signal with little background. Sections can also be projected onto a single image, giving highly resolved artificial two-dimensional images (Figure 6). All images are viewed on a computer screen. Time-resolution of the technique is, in general, inversely proportional to spatial resolution. Thus, the more optical sections imaged, the larger the time intervals between image collections at any given focal plane. This type of microscope is not efficient for examining processes that occur over intervals of seconds or faster.
This instrument consists of a compound microscope equipped with a laser for fluorophore excitation, and a special detection set up consisting of a small pinhole through which emitted fluorescence light produced only near the focal plane of observation can pass. Light passing through the pinhole is collected in a sensitive light detector, and images are produced on a computer screen. This technique eliminates out-of-focus fluorescence, giving sharp images with little background (for more details see http://www.microscopyu.com/articles/confocal/). As with the deconvolution microscope, images consist of optical sections through the sample. Time-resolution of this microscopy is affected by several factors, including the time required for the laser to scan the field of view, and the amount of light that needs to be collected to visualize fluorescence. Unlike the deconvolution microscope, which uses all the light emitted by the sample to calculate the point of emission, a confocal microscope only collects light traveling through the pinhole, necessitating longer exposures or more sensitive light-detection systems.
This instrument is a variation of the laser scanning confocal microscope. Here, many pinholes are arranged in a spiral pattern on a disc that can rotate at high speed. Thus, time resolution can be excellent (on the order of l00 msec or less), and photobleaching is generally not a significant issue as with other microscopes (Nakano, 2002). Image display is essentially as with the standard confocal microscope (Figure 7).
The output from this microscope is similar to that from deconvolution or confocal microscopes. Thus, optical slices of images are generated that can be reconstructed to form a three dimensional image. Multiphoton microscopy eliminates out-of-focus light by directing excitation to the focal plane. This is accomplished by shining photons of long wavelengths and at high density onto the sample. At the focal plane long wavelength photons can superimpose to become, effectively, a shorter wavelength photon. This photon can now excite the fluorophore and induce fluorescence. Superposition of photons occurs significantly only at the focal plane. Multiphoton microscopy is also useful for looking at samples that are much thicker than confocal or deconvolution samples, with nearly equivalent resolution (Helmchen and Denk, 2002; Michalet et al., 2003).
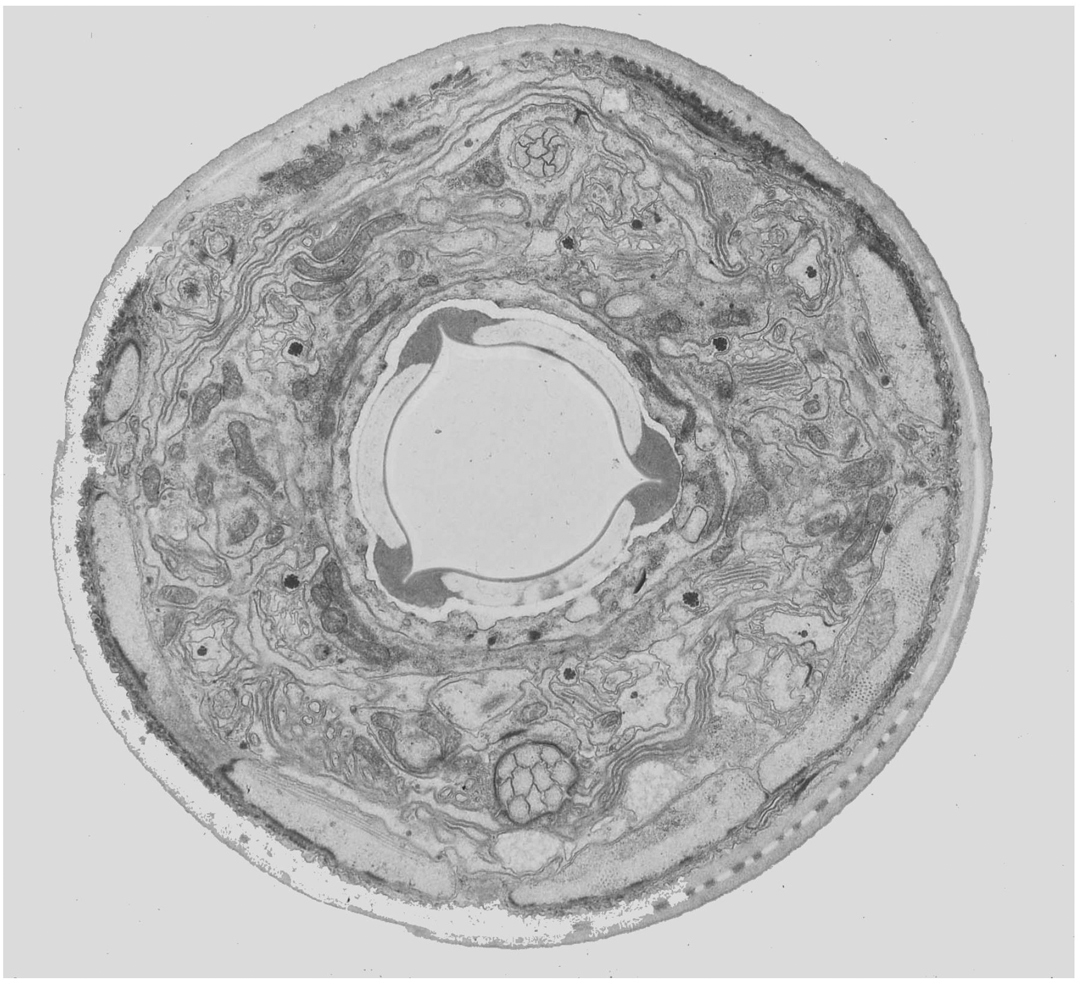
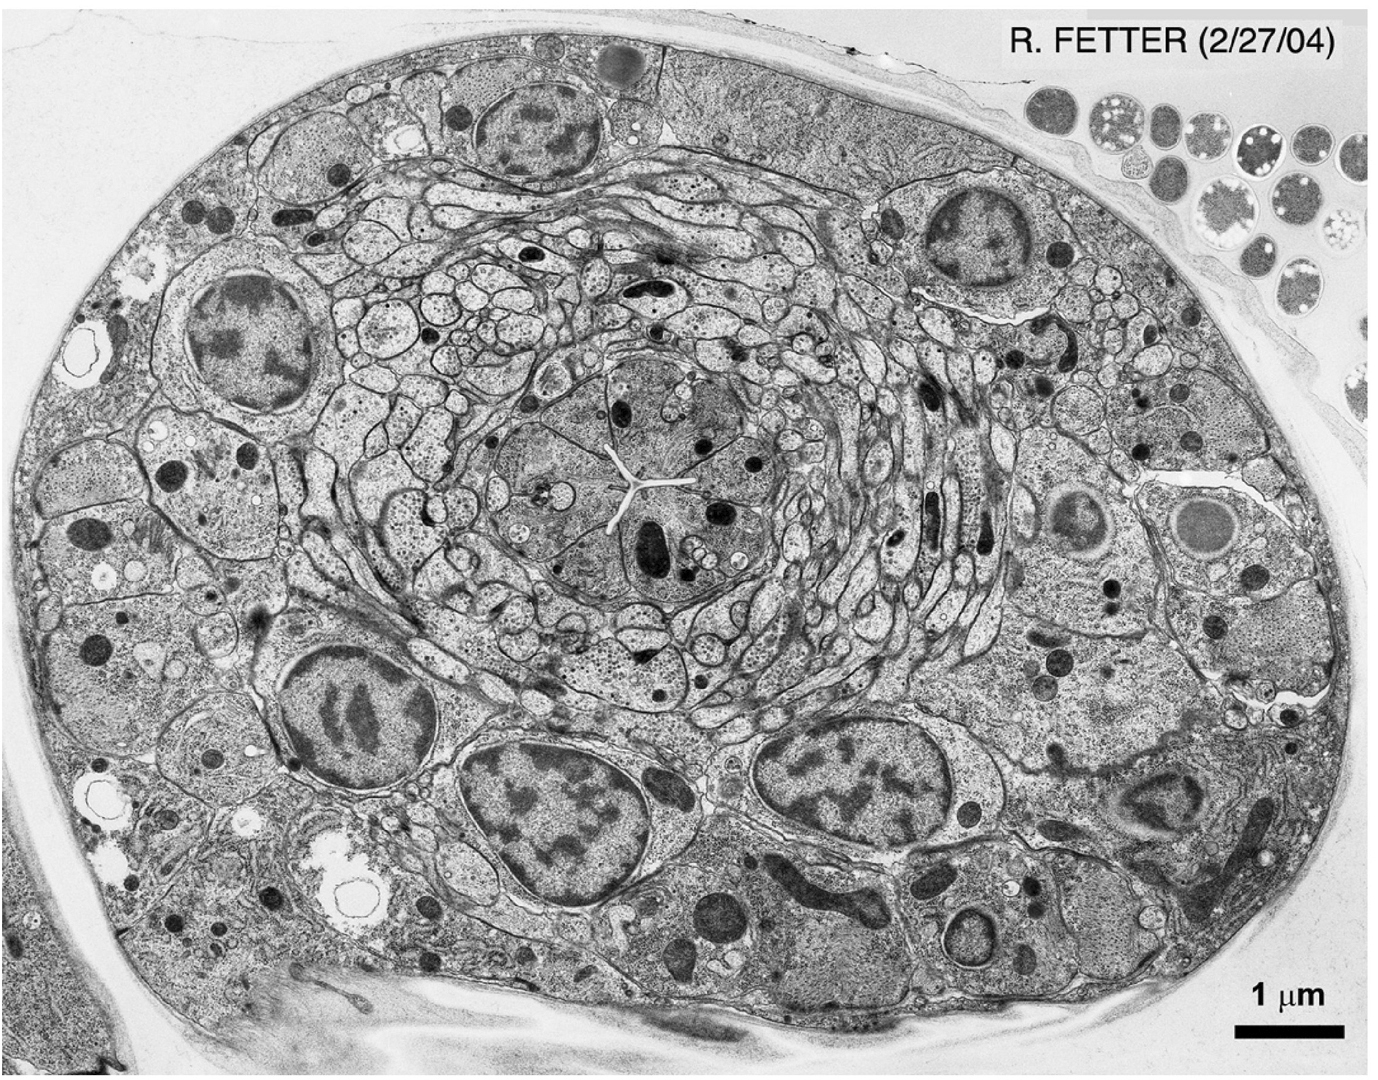
Electron microscopy (EM) is currently the method of choice for examining subcellular structures in C. elegans. The resolution offered by the technique is unparalleled, allowing objects as small as, or even smaller than ribosomes to be viewed. Although EM is technically demanding, it is well worth the effort if resolution of small structures is of importance. Transmission EM (TEM) generally involves fixation of animals with any combination of gluteraldehyde, paraformaldehyde, or osmium tetraoxide (OsO4), embedding of fixed animals in a special resin, sectioning animals (sections are usually 50–100 nm thick), staining, and imaging on an electron microscope (Hall, 1995; Figures 8 and 9). Fixation conditions are generally the key to a successful EM experiment. Standard treatments with fixatives are adequate for most applications, however, they have the disadvantage that cellular structures are often slightly distorted because of osmotic imbalance and other damage that occurs during the fixation procedure. High Pressure Freezing (HPF) has recently been employed to avoid these issues. Tissues and cells are generally rounder, and the ultrastructure seems to reflect the in vivo structures more accurately (Figure 10). Because HPF fixation has only recently come to prominence in C. elegans, a number of issues still remain to be addressed with the technique. Specifically, results are often more variable than using standard fixation. In addition, embryos and L1 larvae seem to fix better than older stages. Interestingly, embryo fixation using standard methods is fairly difficult, thus, HPF and standard techniques are somewhat complementary.
|
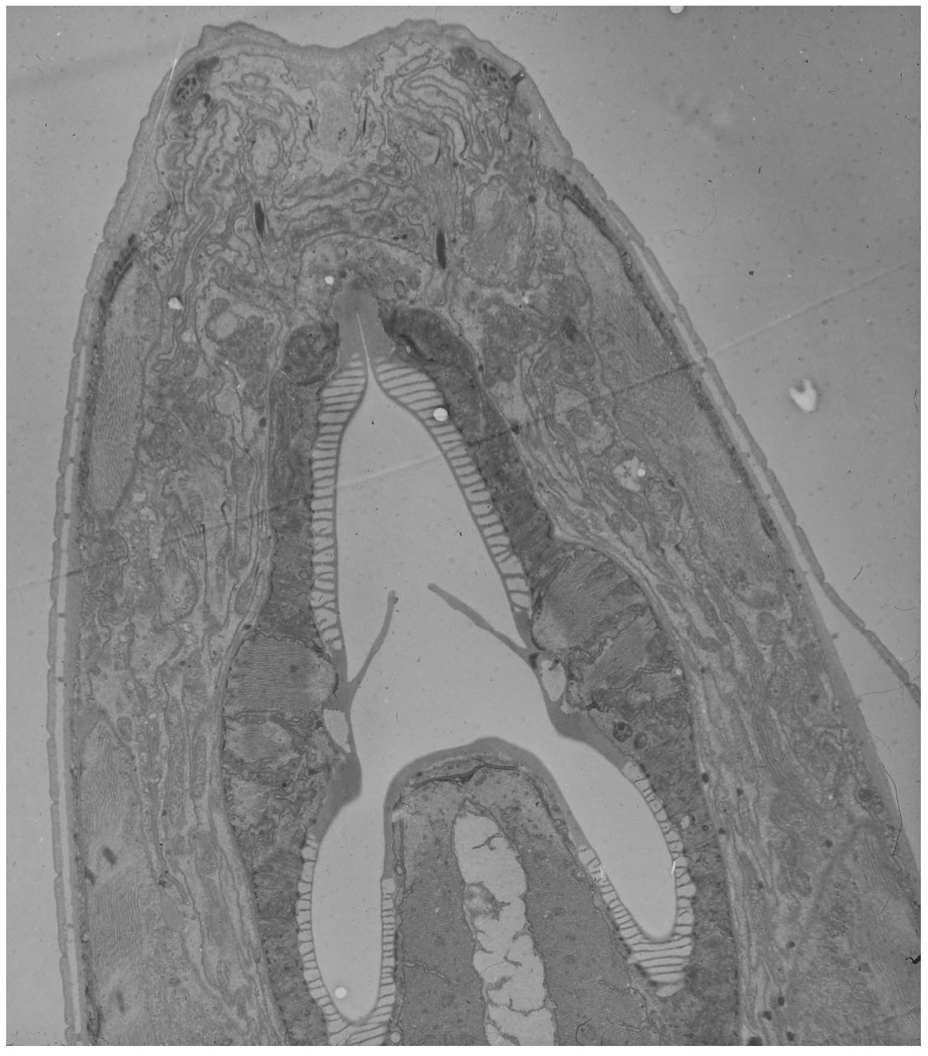
Figure 8. TEM micrograph of a longitudonal section of the C. elegans nose (Erika Hartwieg and Bob Horvitz).
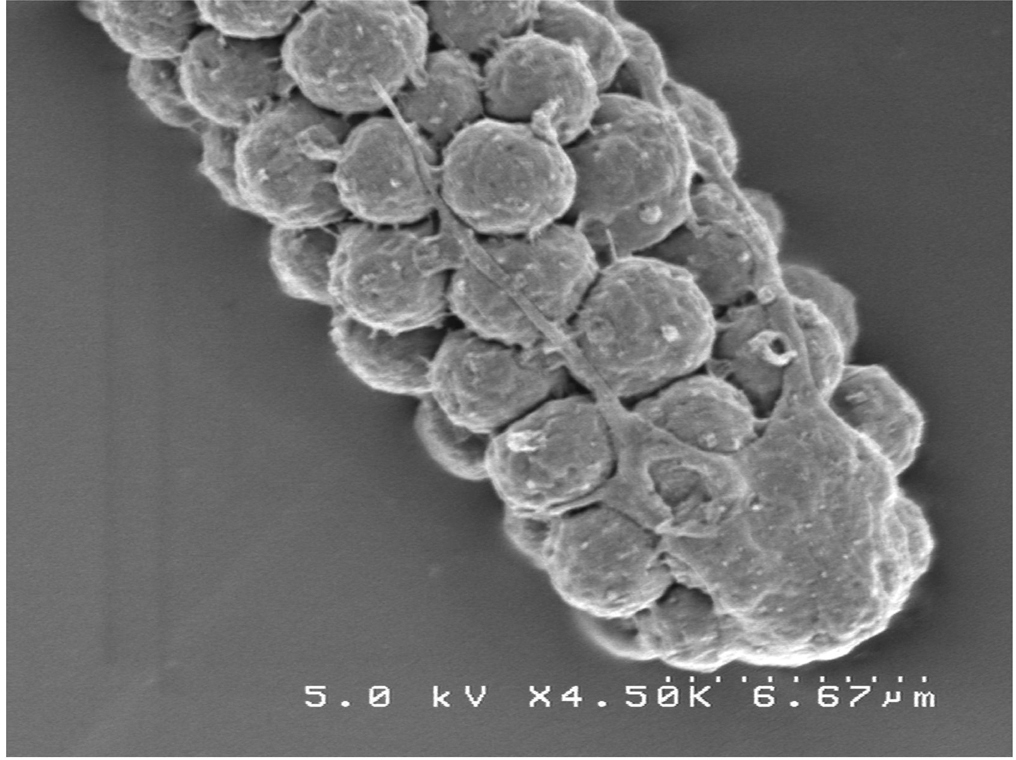
Because fixation is so critical for good ultrastructure, we present below several alternative protocols for TEM. At the end of the section we present a method for scanning EM (SEM) of worms. In this method, whole-mount animals or structures are viewed by EM, offering both broad-scale and highly resolved images (Figure 11).
The protocols below are intended to give a sense of the types of fixation procedures used for EM and should be used as guidlines for those with previous EM experience. These protocols are not intended for teaching EM from scratch.
An important task in deciphering protein function is the identification of other entities with which it interacts. Although C. elegans has not been exploited as an organism for biochemical analysis it is clearly amenable to such studies. Below are protocols describing immunoprecipitation (IP) and chromatin immunoprecipitation (ChIP) that should serve as general guidelines for in vivo interaction studies in C. elegans. These interactions can often be confirmed by standard in vitro techniques such as two-hybrid, GST pull-down studies, and electrophoresis mobility shift assays (EMSA).
Endocytosis has been studied in two cell types in C. elegans: coelomocytes, and oocytes (Fares and Greenwald, 2001; Grant and Hirsh, 1999). Coelomocyte endocytosis is usually assayed by uptake of proteins conjugated to dyes that are injected into the body cavity. Oocyte endocytosis is measured by uptake of GFP-tagged yolk protein secreted by the intestine. Below are protocols for both assays.
Specific chromosomal sequences, as well as chromosome-associated proteins can be elegantly labeled in C. elegans using immunofluorescence and fluorescence in situ hybridization (FISH) (Figure 12). In general, signals are easier to detect and resolve in larger nuclei, thus, best results are obtained by looking at germ cells, intestinal cells, and cells in the early embryo. A variety of protocols related to chromatin visualization are presented below.
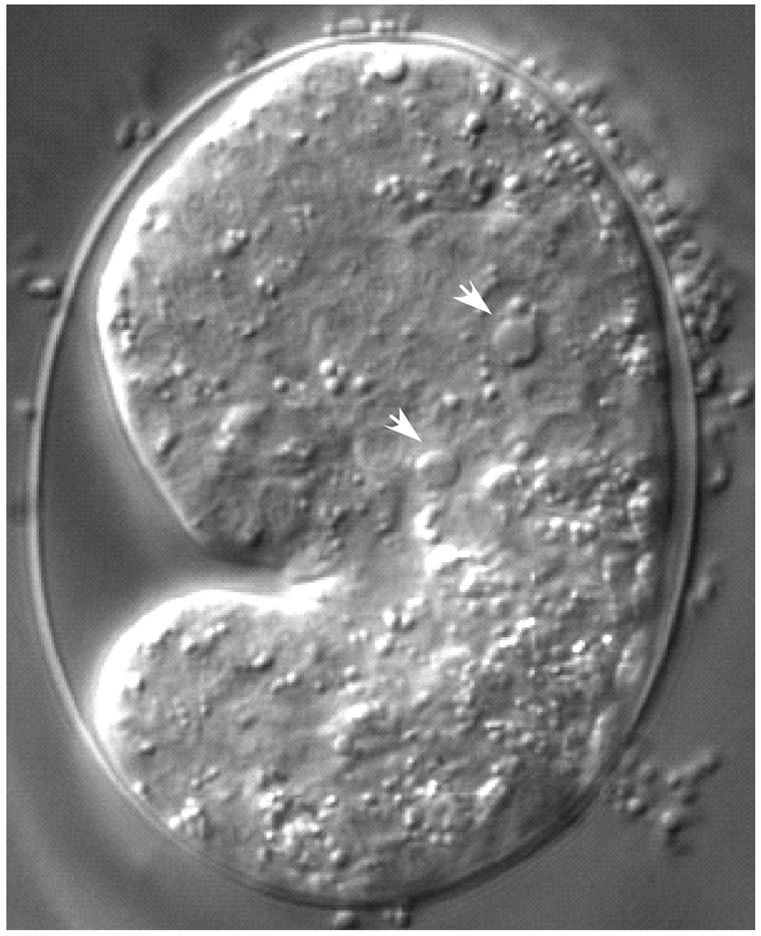
Dying cells can be detected by their morphology and refractility using differential interference contrast microscopy (DIC; see above; Sulston and Horvitz, 1977). A cell corpse appears as a highly refractile, button-like structure (Figure 13), which is rapidly engulfed and degraded by neighboring cells. Cell death occurs in the C. elegans soma mainly during embryogenesis and in the female germ line as a normal course of development (Gumienny et al., 1999). Germ-cell death can also be induced by DNA-damaging agents or by pathogenic bacteria (Aballay and Ausubel, 2001; Gartner et al., 2000). Below we present several protocols for detecting dying cells in the soma and germ line.
|
Figure 13. DIC image of wild-type embryo at comma stage of development. Arrows point to the round, button-like corpses (Julia Hatzold and Barbara Conradt).
TUNEL (TdT-mediated dUTP Nick End Labeling) labels DNA ends, and therefore also dying cells, in which DNA becomes degraded (Gavrieli et al., 1992). TUNEL can be used as a marker for dying cells and to analyze DNA degradation. DNA degradation occurs very rapidly during cell death, thus, TUNEL stains apoptotic cells only during a transient stage of DNA degradation. For this reason, usually only a small subset of corpses is labeled with this technique. However, in nuc-1 mutants, which are defective in some aspects of DNA degradation, the nuclei of many dying cells can be labeled using this method (Wu et al., 2000).
SYTO dyes (Molecular Probes) clearly label DNA in all cells. However, condensed DNA in apoptotic cells (“dead nuclei”) stains more brightly than DNA in living cells. SYTO11, SYTO12, and Acridine Orange have given the best results (Gumienny et al., 1999; Wu et al., 2000; Figure 14).
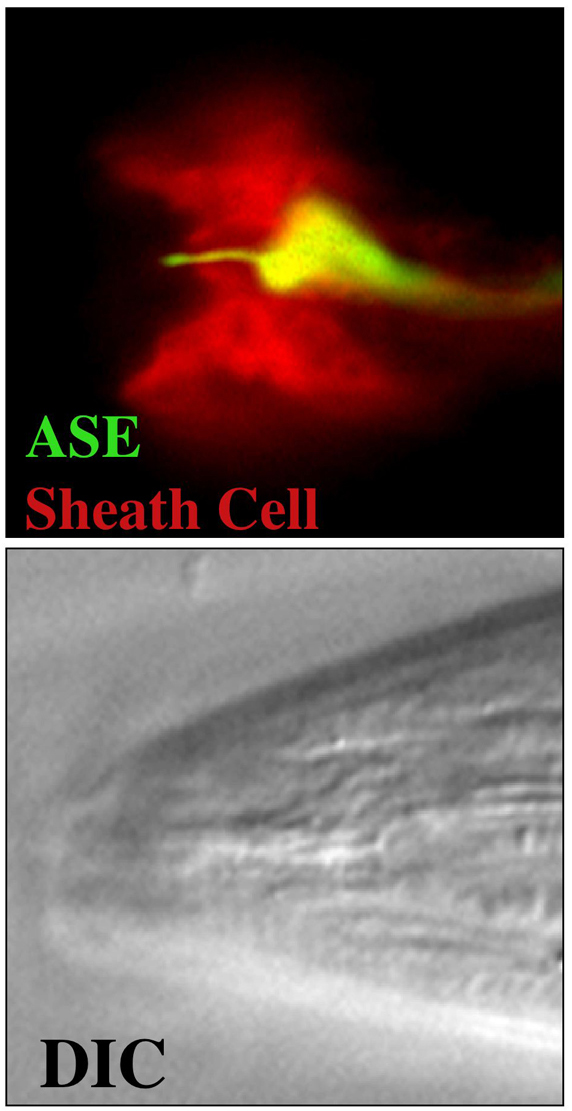
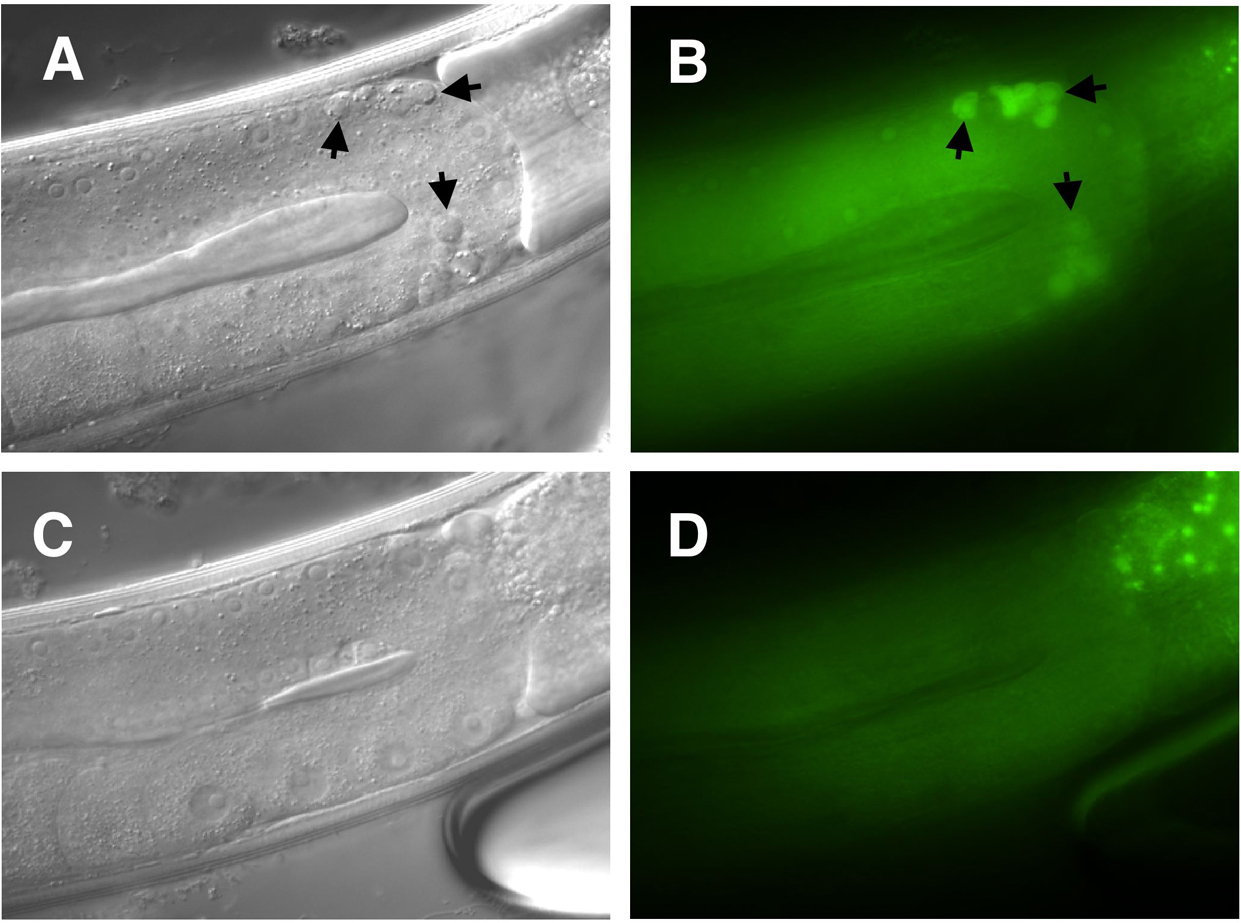
Plim-7ced-1::gfp expresses a CED-1::GFP fusion protein under the control of the lim-7 promoter (Zhou et al., 2001). The lim-7 promoter drives expression specifically in the sheath cells that form the gonadal tube. These cells are responsible for the engulfment of dying germ cells. The CED-1 protein is a transmembrane protein that is expressed on phagocytotic cells. After contact with an apoptotic cell, the CED-1 protein clusters around the apoptotic cell (Zhou et al., 2001; see Figure 15). This reporter makes it easier to score germ cell death. Even cells at an early apoptotic stage that would hardly be recognizable by DIC are already surrounded by the CED-1::GFP protein. One disadvantage of Plim-7ced-1::gfp is the fact that it only weakly labels corpses in genetic backgrounds that cause massive germ cell death, like in ced-9(lf) animals, in which most, if not all, germ cells die.
|
Figure 15. A. DIC image of a wild-type adult hermaphoridite gonad arm showing a single corpse (arrow). B. DIC image of an engulfment defective mutant. Dying cells are indicated by arrow. C and D. Fluorescence images of the Plim-7ced-1::gfp reporter corresponding to A and B, respectively (Claus Schertl and Barbara Conradt).
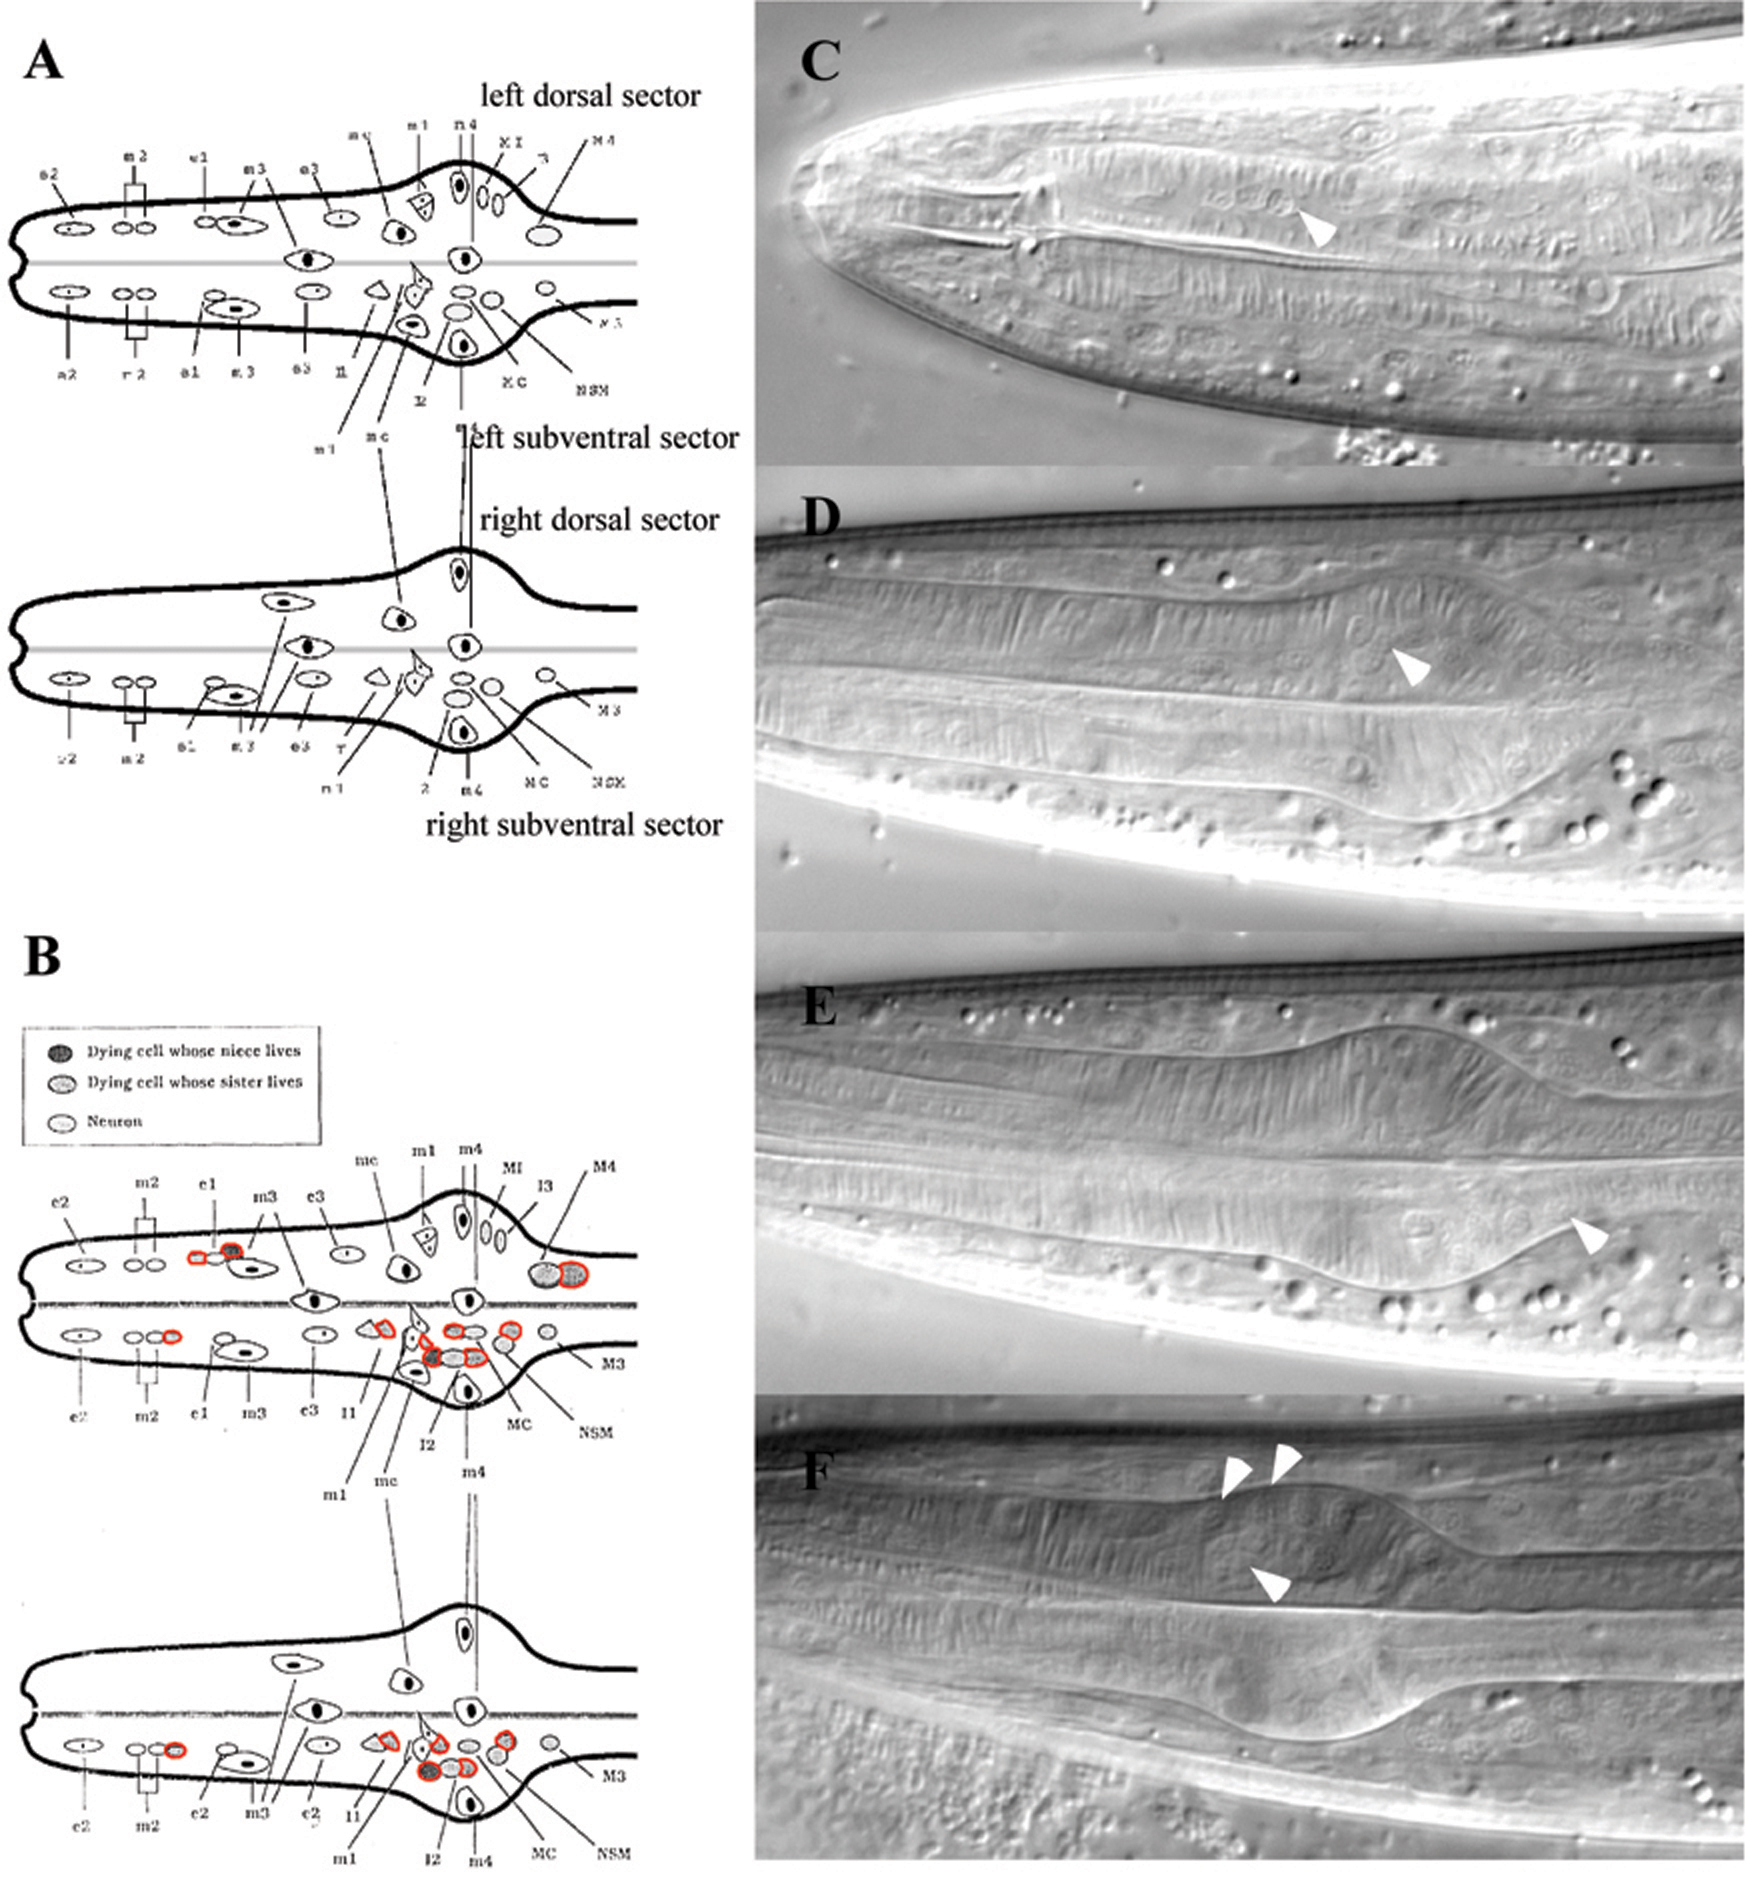
A structure that is particularly convenient for analyzing in appropriate cell survival is the anterior pharynx. Nuclei in the anterior pharynx are relatively easy to identify in L3 or L4 larvae by DIC microscopy (Figure 16; Ellis and Horvitz, 1991). During the development of the anterior pharynx, 16 cells undergo programmed cell death in wild-type animals. In egl-1(lf), ced-4(lf), ced-3(lf) and ced-9(gf) animals, in which cell death is blocked, 11–12 extra nuclei can be detected on average in the anterior pharynx. Extra cells in the anterior pharynx appear in distinct positions as shown in Figure 16. The number of extra cells is a measure of the extent of the cell death defect.
|
Figure 16. A block in cell death, e.g. caused by a loss-of-function in ced-3, results in the appearance of extra cells in the anterior part of the pharynx. A. schematic representation of the anterior part of a wild-type pharynx. B. Schematic representation of the anterior part of a ced-3(lf) pharynx. In red, extra nuclei are indicated that can be scored as an assay to evaluate a block in cell death. C-E. Nomarski pictures of pharynxes of ced-3(lf) animals. Arrowheads indicate extra nuclei (Julia Hatzold, Barbara Conradt, Ron Ellis).
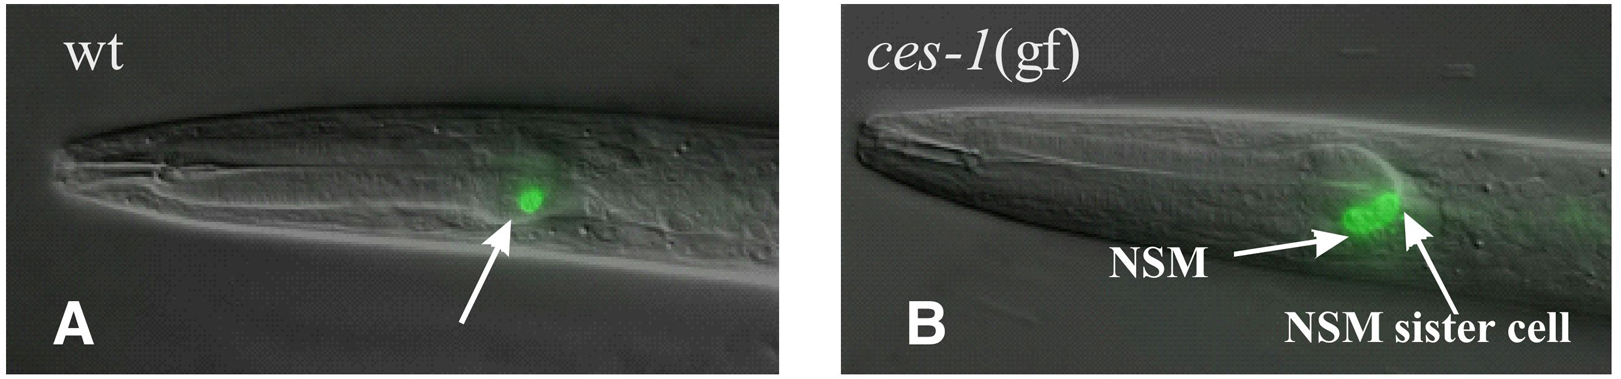
Inappropriate cell survival can also be scored using gfp reporter transgenes. For example, Ptph-1gfp, is expressed in the NSM neurons and in their sisters if the latter are allowed to survive (Thellmann et al., 2003; Figure 17).
|
Figure 17. A tph-1::gfp reporter is expressed in the NSMs in the anterior part of the pharynx. A. One fluorescent cell can be detected on each side (left and right) of a wild-type animal. B. In a ces-1(gf) animal, the surviving NSM sister cell can be visualized by gfp expression posterior to the NSM (Julia Hatzold and Barbara Conradt).
Most somatic cell deaths occur during embryogenesis and in wild-type animals the cell corpses are engulfed and rapidly degraded. Therefore, cell corpses are rarely found in the head region of freshly hatched L1 larvae (Sulston and Horvitz, 1977; Sulston et al., 1983; Sulston et al., 1983). In ced-1(e1735) animals, however, engulfment is blocked, resulting in the accumulation of cell corpses in L1 larvae (about 23 corpses). If cell death is blocked in this mutant background, for example by a ced-3(lf) mutation, few or no cell corpses are detected (Ellis et al., 1991; (Ellis et al., 1991). Therefore, this assay can also be used to determine if cells that are destined to undergo programmed cell death failed to die.
The analysis of cell corpses in L1 larvae can give information about mutations that result in an engulfment defect. Since 113 out of 131 cell deaths occur during wild-type embryogenesis, no cell corpses are detected in the pharynx of L1 larvae Sulston and Horvitz, 1977; Sulston et al., 1983; Sulston et al., 1983). Therefore, mutants, in which persistent corpses can be detected in freshly hatched L1 larvae, might be defective in engulfment.
Studying cellular processes in a living C. elegans offers the advantage of a physiological environment in which these processes occur. However, because of the small size of the animal, and because the cuticle of the animal is a significant permeability barrier, many experiments are difficult or impossible to perform. Thus, for example, rapid modulation of cellular components using drugs is nearly impossible. Furthermore, studies of a particular process may be hampered by other physiological events surrounding the cell being examined, making results sometimes difficult to interpret. Cell culture offers an alternative to in vivo studies, where problems such as those discussed above are obviated (Christensen et al., 2002; Zhang et al., 2002). Interpretation of experiments using cultured cells, of course, suffers from the non-physiological conditions under which the cells are grown. Thus, culture studies and in vivo studies can be complementary, and together can yield significant insight into cell biological questions.
Particular cell types can be labeled with GFP, sorted using fluorescence activated cell sorting (FACS), and studied as a homogeneous population (e.g. to examine expression using gene arrays). Furthermore, RNA interference can be used to inactivate gene expression in cultured cells, allowing for a quasi-genetic dissection of processes in culture. Finally, cells in culture are readily accessible to electrophysiological studies. Methods for culturing embryonic cells were recently developed (Christensen et al., 2002; Zhang et al., 2002) and protocols are presented below (Figure 18). The procedure has been mostly tried with embryonic cells. In general, differentiation of cells in culture seems to proceed through what would be the L1 stage. Markers specific for later stages are not expressed.
|
Figure 18. Profiling GFP-labeled embryonic cells. Intact embryos are isolated from gravid adults by hypochlorite treatment. 1. Treatment with chitinase releases embryonic blastomeres. 2. Cells marked with GFP reporters expressed in early embryos (i.e., before morphogenesis at ~400 min) are isolated by FACS (e.g. myo-3::GFP body muscle cells) (Green arrows). 3. Alternatively, dissociated blastomeres can be cultured for 24 hr to generate GFP-labeled cells that emerge later in embryonic development (e.g. unc-4::GFP in DA motor neurons) (brown arrows). 4. GFP-marked cells are isolated by FACS and RNA extracted for application to the C. elegans Affymetrix Gene Chip. 5. (Rebecca M. Fox, Susan J. Ruff, and David M. Miller III)
Protocol 32: MAPCeL (Micro Array Profiling C. elegans Cells): Embryonic cell culture and FACS for in vitro and gene array studies (Rebecca M. Fox, Susan J. Barlow, Stephen E. Von Stetina and David M. Miller III)
These methods can be used to generate transcriptional profiles of specific cell populations (Fox et al., 2005).
Embryo isolation
Synchronize worms by allowing them to exhaust the food supply and starve Remove a small square of agar to transfer dauer larvae to 150 mm 8P plates inoculated with Na22. Grow for one generation (~3 days) until plates are crowded with gravid adults. Average yield is ~107 embryonic cells per 150 mm plate. The procedure outlined below is appropriate for a cell preparation from 5–10 plates of worms.
Wash the worms off of each plate with sterile water into a separate 15 ml conical tube.
Centrifuge for 2.5 minutes at 2500 rpm (250xg).
Treat with 5 ml of Bleach Solution for 5 minutes.
Add 10 ml of egg buffer to stop the reaction and centrifuge for 2.5 minutes at 2500 rpm.
Wash 3 times in quick succession with egg buffer, or until you can no longer smell the bleach.
To separate embryos from carcasses and debris, resuspend pellet in 10 ml of 30% sucrose solution (5 ml 60% sucrose plus 5 ml water) and centrifuge for 2.5 minutes at 2500 rpm.
Remove embryos (floating on top) with a transfer pipette along with no more than 5 ml of sucrose solution.
Dilute to 15 ml with Milli-Q water and centrifuge at 2500 for 2.5 minutes to pellet the embryos.
Remove supernatant and proceed to laminar flow hood for additional steps.
Dissociating embryos to release early embryonic cells.
Early embryos (before morphogenesis, < 400 min) are largely dispersed to single cell suspensions by these methods whereas older embryos are not. In fact, late stage embryos can be seen crawling around in these preparations prior to their removal in the filtration step (see below).
Resuspend embryos in 0.5 ml of sterile chitinase (0.5 U/ml).
Incubate at RT for ~45 minutes with gentle rocking on nutator. Examine under a dissecting scope after 30 minutes to check for dissociation of embryos. Some batches of chitinase are more potent than others.
To stop the reaction, top off the tube (~1 ml) with L-15-10 media (see below) and centrifuge at 12,000 rpm (1300xg) for 2 minutes in microfuge.
Aspirate supernatant and resuspend pellet in 1 ml of L-15-10 media with P1000 pipetman.
Preload 3cc syringe with 0.5 ml media and draw up cell suspension into barrel. Gently push sample through a 5 μm syringe filter into a 1.5 ml microfuge tube. To recover more embryonic cells, reload the syringe with ~1.5 ml media and push it through the filter again into a second microfuge tube. The filtration step is crucially important for removing cell clumps and undissociated embryos.
Centrifuge for 3 minutes at 6000 rpm (350xg) in microfuge at RT.
Remove supernatant. For preparations that will be sorted immediately to isolate GFP-labeled cells, resuspend the pellet in egg buffer (~107 cells/ml; See FACS protocol, Section D. below). For cells that will be maintained in culture, resuspend pellet in L15-10 media (~107 cells/ml). (See cell culture protocol, Section C. below.)
Count cells with a hemocytometer.
Primary culture of C. elegans embryonic cells for in vitro experiments.
For cells that will be characterized in culture (e.g. patch clamping, immunofluorescence staining, etc.), apply the suspension of embryonic blastomeres (~107 cells/ml in L15-10 media) to peanut agglutinin-coated glass surfaces (see below).
Cells are cultured at 25°C. Place the culture chamber inside a covered petri dish with a moist paper towel to retard evaporation.
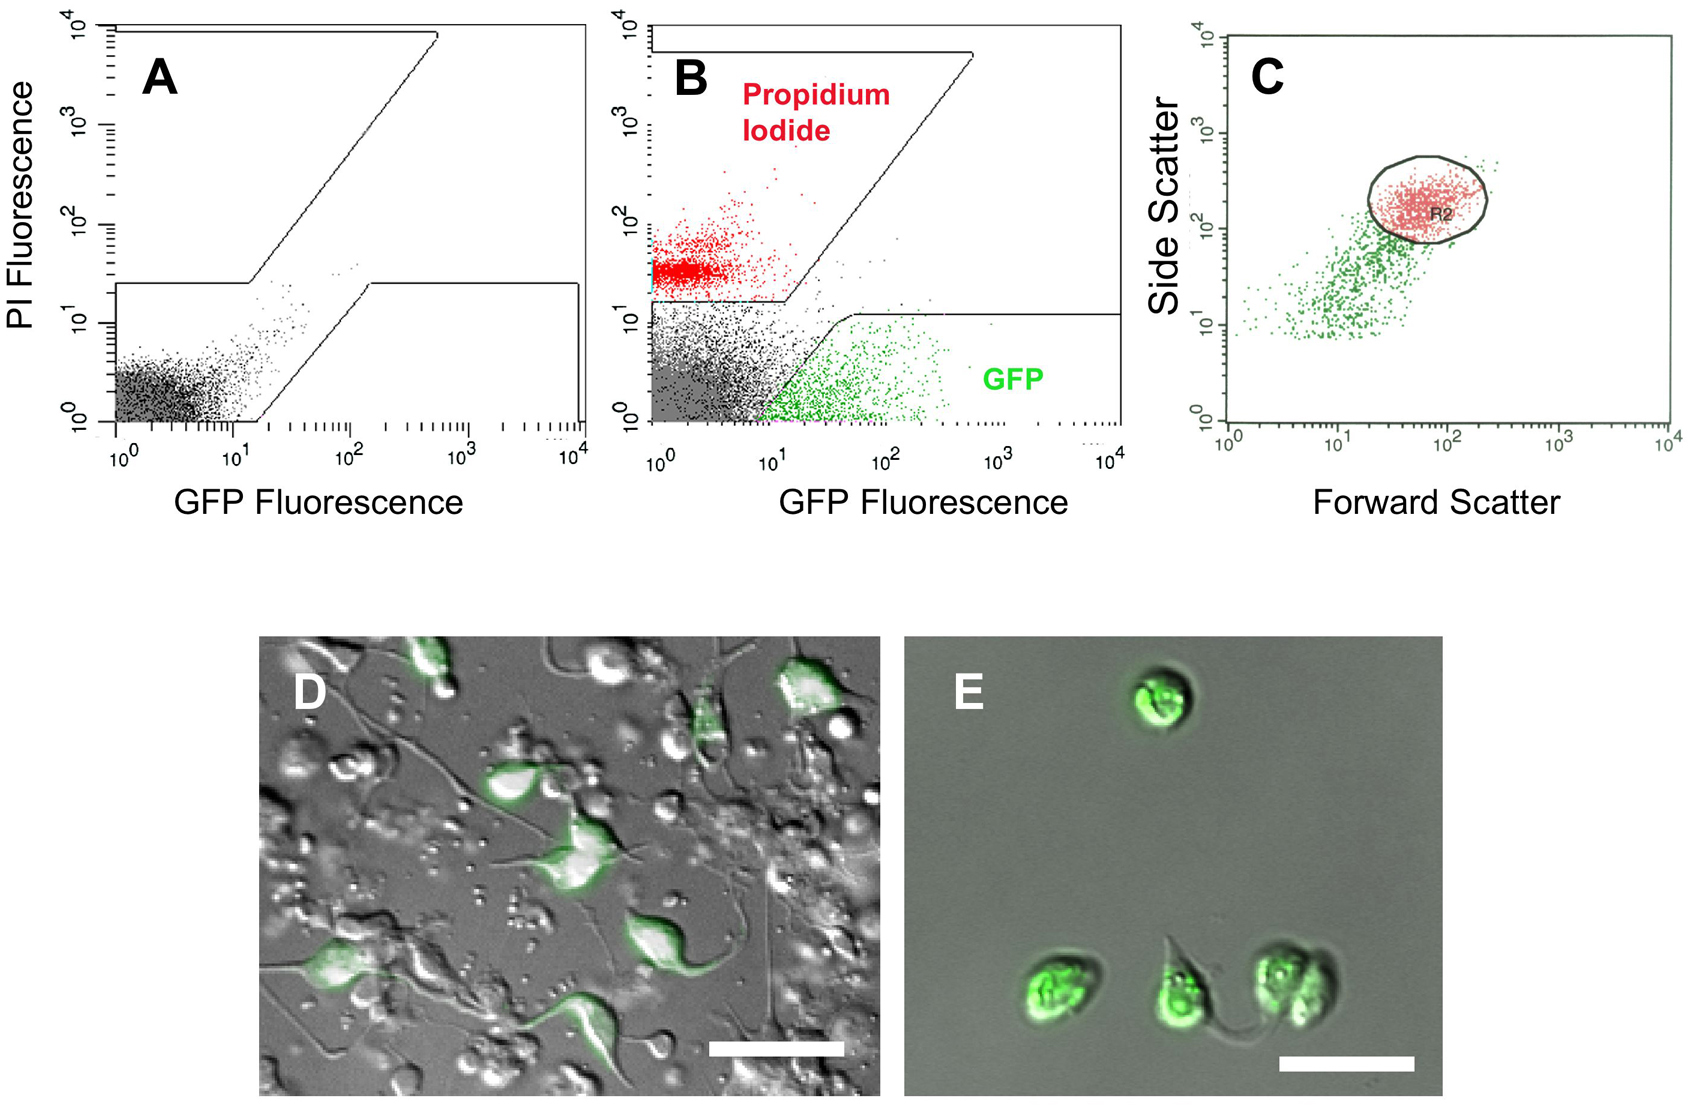
Cells are tightly adherent to peanut agglutinin-coated glass. Within 24 hr of plating, body muscle cells assume a bipolar spindle shaped morphology (Figure 19 D,E) and neurons extend elongated processes (Figure 20). Media is changed at 3–4 day intervals and cultures maintained for ~ 2 weeks.
|
Figure 19. Isolation of embryonic muscle cells by FACS. A. Fluorescence intensity profile of wildtype (non-GFP) cells. Boxed areas exclude autofluorescent cells (arrow). B. myo-3::GFP cells are gated to exclude propidium iodide-stained (non-viable) cells. C. Light scattering gate(R2) for GFP-positive cells (circle). D. Mixed population of embryonic cells from myo-3::GFP embryo before sorting. E. myo-3::GFP cells after FACS enrichment (~90%). Scale bars are 5 mm. (Rebecca M. Fox, Susan J. Ruff, and David M. Miller III)
Primary culture of C. elegans embryonic cells for isolation by FACS.
GFP markers expressed in late stage embryos (> morphogenesis; e.g. unc-4::GFP) are rarely observed in freshly prepared suspensions of blastomeres but do emerge with overnight culture. To recover these cells for isolation by FACS, we plate them on poly-L-lysine from which they can be readily dislodged the next day with gentle mechanical disruption.
Plate cells in L15-10 media (~107 cells/ml) on poly-L-lysine coated slides and allow to differentiate overnight. Single-well chamber coverglasses work well for this application.
Remove media and replace with 1 ml Egg Buffer.
Wash cells from slide using P1000 pipetteman. Cells are loosely adherent and are easily dislodged.
Pool cell suspensions (~3 ml) and pass through Durapore syringe filter (5 μ) into 15 ml conical tube.
Prepare cells for FACS isolation.
Cells from freshly dissociated embryos or from 24 hr primary cultures are dispersed in egg buffer as described above.
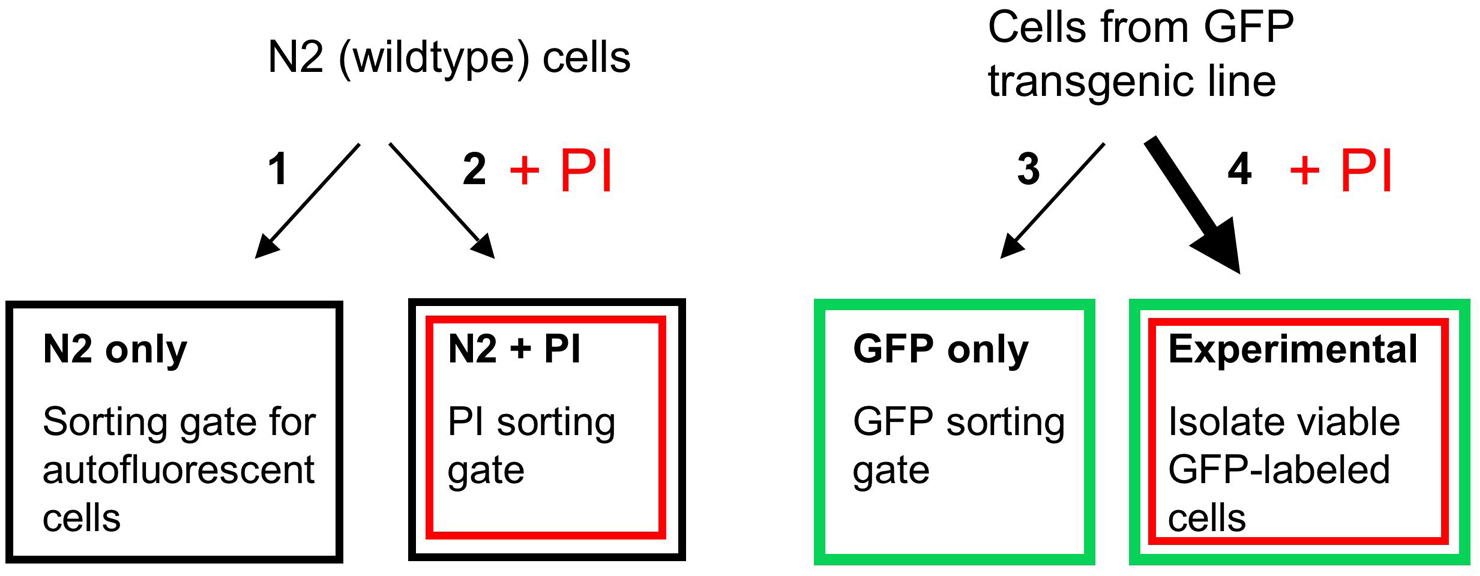
You will need four separate preparations of cells for each sorting experiment (see below; Figure 20).
N2 only—non-GFP cells to identify autofluorescent cells
N2 + PI—non-GFP cells plus Propidium iodide to set gate for PI-stained cells
GFP only—Cells from GFP transgenic embryos to set GFP gate
Experimental—Cells from GFP transgenic embryos + PI. Sort to isolate GFP cells
N2 only. Prepare cells (~106) from wildtype (N2) embryos.
N2 + PI. Add propidium iodide (PI) to a separate tube of N2 cells (~106).
GFP only. Set aside a small aliquot (e.g., ~106 cells in 250 ul) of cells prepared from the GFP transgenic line.
Experimental. Transfer the remainder of cells from the GFP transgenic line (2–2.5 ml) to another FACS tube and label, “Experimental.” The cell suspension should be clear. If cloudy, add egg buffer to achieve the ideal concentration of ~5–10 million cells/ml.
Add propidium iodide (PI) to the “Experimental” tube immediately before sorting to a final concentration of 5 μg/ml. (e.g. 1 ml of 15 μg/ml PI stock added to 2 ml of cell suspension.) PI stains dead or damaged cells instantly but will also label viable cells after prolonged exposure (2–3 hr).
Preparing the FACS machine for sorting C. elegans cells.
It is critically important to flush the FACS machine with egg buffer prior to sorting as viability is reduced by exposure to the lower osmolarity of PBS solutions typically used for sorting mammalian cells.
Use 2 μ fluorescent beads to calibrate light scattering gates to match the relatively small size of C. elegans embryonic cells.
Use the N2 only sample to generate a fluorescence intensity scatter plot for the PI and GFP channels. Because autofluorescent gut cells are detected in both channels they are largely restricted to the diagonal axis of this scatter plot (Figure 19A).
Next, N2 + PI cells are used to establish a sorting gate for dead or damaged cells (Figure 19B).
Flow cytometry of the GFP only sample is used to discriminate between autofluorescent and GFP-labeled cells (Figure 19B). We typically use all of these controls prior to every FACS run to re-establish the sorting gate for viable, GFP cells.
Isolating GFP cells by FACS
The Experimental sample containing GFP + PI-stained cells is now sorted and viable GFP cells collected (Figure 19B).
We have also found it helpful to simultaneously gate GFP cells by light scattering parameters to remove debris and cell clumps (Figure 19C). This gate is empirically defined (see below)
Cells are collected in 15 ml conical tubes preloaded with 1 ml of L-15-10 media.
For microarray experiments, we collect at least 100,000 GFP cells for each hybridization. For less abundant cell types (e.g. unc-4::GFP) it is necessary to pool cells from multiple runs to reach this figure. In other cases (e.g. myo-3::GFP) more than enough cells are generated in a typical 1–2 hr sorting run.
Adjusting FACS sorting gates
Sorting gates are empirically defined for each new GFP line by replating initial batches of sorted cells (on peanut lectin) and then counting GFP vs non-fluorescent cells on the following day. This step is especially important for defining light scattering parameters. Using this approach, we have achieved ~90% enrichment of GFP cells for a wide range of neuron and muscle-specific markers (R. Fox, S. Von Stetina, S. Ruff, D. M. Miller, manuscripts in preparation).
All steps are performed in a laminar flow hood.
Transfer sorted cells (~3ml volume) into 1.5ml Eppendorf tubes.
Centrifuge at 6000 rpm (350xg) for 5 min in a microfuge.
Remove most of the supernatant. It is important to be VERY careful because you cannot see a pellet. We generally leave ~100ul of solution in the tube. This can then be transferred to a peanut lectin-coated slide for visualization. MatTek round dishes work well.
Determine the fraction of GFP-positive cells 24hr after replating by direct inspection in inverted microscope.
Isolating RNA for Microarray experiments.
Transfer sorted cells (~3 ml volume) into 1.5 ml Eppendorf tubes.
Centrifuge at 6000 rpm for 5 min in a microfuge.
Isolate RNA with Stratagene micro RNA isolation kit (200344) – use volumes suggested for 106 cells.
Yields are typically ~ 1pg total RNA/cell.
Lyophilize pellets and store at −80°C.
| Equipment |
| Tissue Culture Hood |
| Clinical Centrifuge |
| Microfuge |
| Inverted compound microscope with fluorescence and DIC optics. |
| Must have at least 40x and preferably 63x, 100x objectives. (e.g. Zeiss Axiovert) |
| Osmometer (Wescor) |
FACS Machine:
Sorting experiments were performed in a FACStar Plus flow cytometer (Becton Dickinson, San Jose, CA) equipped with a 488 nm argon laser and FITC filter set. Emission filters were 530±30nm for GFP fluorescence and 585±22nm for PI fluorescence. Sorting rates were 4000–5000 cells per second through a 70μm nozzle.
REAGENTS AND MATERIALS
Peanut lectin coated slides – We routinely use γ irradiation (overnight) to sterilize peanut agglutinin powder. Dissolve in sterile dH20 at 0.5 mg/ml and use to coat entire surface of slide (e.g., for 1-well chamber coverglass add 2ml). Incubate for ~20 min in a tissue culture hood. It is important to remove excess liquid prior to adding cells to avoid clumping. As an alternative to γ irradiation, slides may also be sterilized by exposure to UV light for 30–60 min after application of the peanut agglutinin solution.
Poly-L-lysine –poly-L-lysine solution (0.01% in sterile H20) is sterilized by filtration (0.2 micron). Apply to coat the entire surface of slide. Incubate for ~30 minutes with chamber covered. Wash slide thoroughly with sterile water; residual poly-L-lysine is toxic to cells. Allow to dry uncovered under tissue culture hood.
| Add 60 ml agar/150 mm plastic petri plate |
| Seed with Na22 bacteria |
| Bleach Solution |
| For 10 ml: |
| 7.5 ml Milli-Q water |
| 2 ml Clorox |
| 0.5 ml 10N NaOH |
| Egg Buffer | 500ml | 1000ml |
| NaCl (118 mM) | 3.448g | 6.896g |
| KCl (48 mM) | 1.789g | 3.578g |
| CaCl2• 2H2O (2 mM) | 0.147g | 0.294g |
| MgCl2• 6H2O (2 mM) | 0.203g | 0.406g |
| HEPES (25 mM) | 2.979g | 5.958g |
| It is important that these weights are exact because of the osmotic sensitivity of C. elegans embryonic cells. |
| Adjust to pH 7.30 with 1N NaOH (no more than 10 ml). |
| The optimum osmolarity is 335–345. Check in osmometer. |
| Sterilize with 0.2 μm bottle top filters. |
| Adjust osmolarity of L-15 media |
| Sucrose is added to increase the osmolarity of L-15 media to 340 mOsm as below: |
| Read L-15 media in osmometer. (~315 mOsm) |
| Calculate final concentration of sucrose needed for adjusting L-15 to 340 mOsm: |
| 340 mOsm – 315 mOsm = 25 mM Sucrose |
| Calculate sucrose (solid) for 500 ml L-15 media: |
| (MW Sucrose = 342.3 g) |
| 0.5 L × 0.025 mole/l × 342.3 g/mole = 4.28 g sucrose |
Confirm final osmolarity of 340–345 mOsm in osmometer.
| L-15-10 Media |
| 500 ml L-15 media adjusted to 340–345 mOsm (see above) |
| 50 ml Heat inactivated FBS (10%) |
| (Heat inactivate FBS at at 56°C for 30 min) |
| 2.5 ml of Pen/Strep (1:200) |
| Sterilize with Nalgene 0.2 μm filter. |
| Store at 4 C. |
| Propidium iodide (3x) |
| 15 ug/ml in egg buffer. Good for 1 week at RT. |
| Catalog numbers: |
| L-15 – Gibco 21083-027 |
| Chitinase – Sigma C-1525 |
| Peanut Agglutinin – Sigma L-0881 |
| Poly-L-Lysine – Sigma P4832 |
| Fetal Bovine Serum –VWR 16777-014; HyClone SH30071.03 |
| Pen/Strep- Gibco 15140-122 |
| Propidium Iodide-Sigma P-4170 |
| Durapore filter (5 μm) – Millipore, SLSV R25 LS |
| Plates etc: |
| MatTek 35 mm Glass Bottom microwell dishes - uncoated |
| P35G-0-14-C |
| LabTek Chambered Coverglass |
| 4 well - 155383 |
| 2 well - 155380 |
| 1 well - 155361 |
LabTekII Chamber slide with Cover (4 well) - 154526
| Tubes |
| 1.5 ml microfuge tubes |
| 5ml Polystyrene Round-Bottom Tube (FACS tube) Falcon 352054 (Fisher) |
Protocol 35: Modified Affymetrix small sample amplification (Steve Von Stetina, Rebecca Fox, and David Miller)
Affymetrix hybridizations require 10–15 ug of labeled probe. Because RNA in this amount is rarely available from FACS isolated cells, we amplify initial RNA preparations with two rounds of a T7 RNA polymerase-dependent amplification protocol. The following bench protocol produces high-quality cRNA from 100 ng of total RNA. This protocol is a modified version of an amplification strategy originally described by Affymetrix (GeneChip Eukaryotic Small Sample Target Labeling Technical Note, Part 701129 Rev 1).
Significant changes include:
6 hr for the RNA transcription step provides higher yields.
For cRNA cleanup, 40% EtOH and two passes through the column dramatically enhanced yields.
Other important points:
The protocol can be divided into two long days or four shorter days; in all, the protocol takes ~24 hours to complete.
We obtain 30–70 ug of labeled cRNA from 100 ng total RNA after two rounds of amplification.
The commercially available fragmentation buffer was more reliable than “home-brewed” solutions. The reasons for this difference are unknown.
It is important to assess the quality and size distribution of amplified cRNA and subsequent fragmented cRNA label by gel electrophoresis (Agilent Bioanalyzer).
MATERIALS
| Reagent Name | Vendor | Catalog # | |||
|---|---|---|---|---|---|
|
Operon (Qiagen) | ||||
|
Invitrogen | 18064-071 | |||
| 5X second strand buffer, 500 ul | Invitrogen | 10812-014 | |||
| E. coli DNA Polymerase, 10 U/ul, 1000 U | Invitrogen | 18010-025 | |||
| E. coli DNA Ligase, 10 U/ul, 100 U | Invitrogen | 18052-019 | |||
| RNase H, 2 U/ul, 120 U | Invitrogen | 18021-071 | |||
| T4 DNA Polymerase, 5 U/ul, 250 U | Invitrogen | 18005-025 | |||
| Random Primers | Invitrogen | 48190-011 | |||
| dNTP mix, 100 mM each | NEB | N0446S | |||
| rRNasin, 40 U/ul 10,000 U | Promega | N2515 | |||
| Glycogen, 5 mg/ml, 5 ml | Ambion | 9510 | |||
| Ammonium Acetate, 7.5 M, 100 ml | Sigma | A-2706 | |||
| MEGAscript T7 kit | Ambion | 1334 | |||
| Affymetrix GeneChip Sample Cleanup Module | Affymetrix | 900371 | |||
| β - mercaptoethanol, 25 ml | Sigma | M-3148 | |||
| Enzo BioArray HighYield RNA Transcript Labeling kit, 10 reactions | Affymetrix | 900182 |
Solutions (USE DEPC-H2O FOR ALL SOLUTIONS):
DEPC-H2O: Fill 4L Flask in RNase-free cabinet with 3.5L of Milli-Q water. In hood, add 3.5 ml DEPC (final concentration is 0.1%). Leave stirring at RT o/n. Autoclave the following day.
5M Ammonium Acetate: Dilute 7.5M NH4Ac to 5M using DEPC-H2O.
Random Primers: Dilute 3 ug/ul stock to 1 ug/ul using DEPC-H2O; store in 5 ul aliquots at −20°C.
10 mM dNTP mix: Mix 100 ul of each dNTP with 600 ul DEPC-H2O. Store in 5 ul aliquots at −20°C.
METHODS
First Amplification Cycle (can split into 2 days if desired)
Step 1. First cycle, first strand cDNA synthesis
Combine100 ng total RNA and the following components in a 1.5 ml RNase free microfuge tube.
Vortex tube then quick spin in small benchtop microfuge (picofuge).
Place tube in 70°C heat block for 10 min.
Chill on ice for 2 min.
Add the following reagents to microfuge tube:
Vortex, spin. Incubate in 42°C water bath for 2 min.
Add 1 ul of Superscript II (200 U/ul) to the preheated reaction, vortex and quick spin.
Incubate at 42°C for 1 hour.
Step 2. First Cycle, second strand cDNA synthesis
Spin down first strand reaction, then cool on ice for 2 min.
Transfer solution to a 0.5 ml RNase-free microfuge tube.
Add following reagents to the first strand synthesis reaction:
Vortex, spin. Incubate at 16°C in a PCR machine for 2 hr.
Add 2 ul of T4 DNA polymerase to the reaction and incubate for an additional 15 min at 16°C. (this step polishes the ends of the dsDNA)
Step 3. First cycle, double-stranded cDNA clean-up by ethanol precipitation.
Following second strand synthesis, transfer contents of 0.5 ml microfuge into a 1.5 ml RNase-free microfuge tube.
Add following to tube (all items stored in RNase-free freezer):
Mix by inversion. Centrifuge for 20 min at 4°C at 14000 rpm. **You should see a pellet!**
REMOVE ETHANOL BY ASPIRATION USING RNase-free ROUND GEL-LOADING TIPS (Marsh Biomedical Products, Inc #T-3000).
Wash with 70% cold ethanol (stored in freezer); spin for 14,000 rpm in microfuge for 5 min at 4°C.
Remove ethanol as above. Speed-vac for 5 min to dry pellet.
THIS IS A POTENTIAL STOPPING POINT. STORE PELLET AT −20°C IF NOT CONTINUING ON TO IVT REACTION.
Step 4. First cycle, in vitro transcription (IVT) for cRNA using Ambion MEGAscript T7 kit
Step 5. First cycle, cRNA clean-up with Affy Cleanup Kit
****Add 10 ul β-ME to every 1 ml IVT cRNA Binding Buffer before starting clean-up****
Add 80 ul DEPC-H2O to IVT reaction (total volume = 100 ul)
Add 350 ul IVT cRNA Binding Buffer; mix. Add 300 ul 100% EtOH. Mix by pipeting.
Add sample (750 ul) to a supplied mini-column. Pulse in microfuge for 15 sec.
Pipet flow-through from collection tube and pulse through mini-column again.
Discard collection tube. Transfer column to a new 2.0 ml collection tube.
Add 500 ul IVT cRNA Wash Buffer. Pulse in microfuge for 15 sec. Discard flow-through.
Add 500 ul 80% EtOH. Spin for 2 min in microfuge at full speed. Discard collection tube.
Transfer column to a kit-supplied 1.5 ml collection tube.
Add 32 ul DEPC-H2O to mini-column. Incubate at RT for 1 min. Spin for 1 min at full-speed.
Determine concentration of cRNA using spectrophotometer.
Add 2 ul cRNA to 98 ul DEPC-H2O (1:50 dilution).
Use lab spec (DNA/RNA calculator) to determine A260.
Determine concentration using conversion factor of 40 ug/ml (for RNA).
If the concentration is less than 10 ng/ul, speed-vac to reduce volume of cRNA from 30 ul to 10 ul (DO NOT DRY ALL THE WAY!) and use all the cRNA for 2nd round.
If the concentration is greater than 10 ng/ul, use 100 ng for next step.
Store cRNA at −80°C o/n.
Second Amplification Cycle
Step 6. Second Cycle, first strand cDNA synthesis
Start with 100 ng of first round cRNA (if you have less, use all of your first round sample).
Mix the following in an RNase-free 1.5 ml microfuge tube:
Vortex and spin.
Incubate in 70°C heat block for 10 min (to denature).
Cool on ice for 2 min.
Add the following to the tube for first strand synthesis (make master mix if more than 1 sample):
Incubate in 42°C water bath for 2 min
Add 1 ul SuperScript II. Vortex, spin.
Incubate at 42°C for 1 hour.
Add 1 ul RNase H.
Incubate in 37 °C water bath for 20 min, then incubate in 95°C heat block for 5 min,
Step 7. Second cycle, second strand cDNA synthesis with T7-(dT)24 primer
Spin down first strand reaction, then add 1 ul T7-(dT)24 primer.
Incubate in 70°C heat block for 10 minutes, then cool on ice.
Transfer solution to a 0.5ml RNase-free microfuge tube.
Add the following reagents to the mix (make master mix if more than 1 sample)
Vortex, spin. Incubate at 16°C in a PCR machine for 2 hr.
Add 2 ul of T4 DNA polymerase to the reaction and incubate for an additional 15 min at 16°C.
Step 8. Second cycle, double-stranded cDNA clean-up by ethanol precipitation.
Following second strand synthesis, transfer contents of 0.5 ml microfuge to 1.5 ml RNase-free microfuge tube.
Add following to tube (all items stored in RNase-free freezer):
Mix by inversion. Centrifuge for 20 min at 4°C at 14000 rpm. **You should have a pellet!**
REMOVE ETHANOL BY ASPIRATION USING RNase-free ROUND GEL-LOADING TIPS.
Wash with 70% cold ethanol (stored in freezer); spin for 14,000 rpm for 5 min at 4°C.
Remove ethanol as above. Speed-vac for 5 min to dry pellet.
THIS IS A POTENTIAL STOPPING POINT. STORE PELLET AT −20°C IF NOT CONTINUING ON TO IVT-LABELING REACTION.
Step 9. Second cycle, IVT for cRNA amplification and labeling with Enzo kit.
Resuspend pellet in 22 ul DEPC-H2O. Vortex and pipet up and down to resuspend pellet.
Add the following to the resuspended pellet: DO NOT MAKE MASTER MIX!
Incubate reaction in 37°C water bath for 6 hours.
Step 10. Second cycle, labeled cRNA target clean-up with Affy Cleanup Kit.
*****Add 10 ul β-ME to every 1 ml IVT cRNA Binding Buffer before starting clean-up*****
Add 60 ul DEPC-H2O to IVT reaction (total volume = 100 ul)
Add 350 ul IVT cRNA Binding Buffer; mix. Add 300 ul 100% EtOH. Mix by pipeting.
Add sample (750 ul) to a supplied mini-column. Pulse in microfuge for 15 sec.
Pipet flow-through from collection tube and pulse through mini-column again.
Discard collection tube. Transfer column to a new 2.0 ml collection tube.
Add 500 ul IVT cRNA Wash Buffer (to wash). Pulse in microfuge for 15 sec. Discard flow-through.
Add 500 ul 80% EtOH. Spin for 2 min in microfuge at full speed. Discard collection tube.
Transfer column to a supplied 1.5 ml collection tube.
Add 32 ul DEPC-H2O to mini-column. Incubate at RT for 1 min. Spin for 1 min at full-speed.
Keep eluate, discard column.
Step 11. Determine concentration, remove aliquots for bioanalysis, fragment labeled cRNA.
Add 2 ul cRNA to 98 ul DEPC-H2O (1:50 dilution).
Use lab spec (DNA/RNA calculator) to determine A260. cRNA should be 0.5–3 ug/ul.
Dilute a portion of labeled cRNA to 100 ng/ul. Remove 3 ul for for gel electrophoresis (Agilent Bioanalyzer)
Fragment RNA in 10–15 ug aliquots.
Incubate at 95°C for 35 min.
Place on ice following incubation.
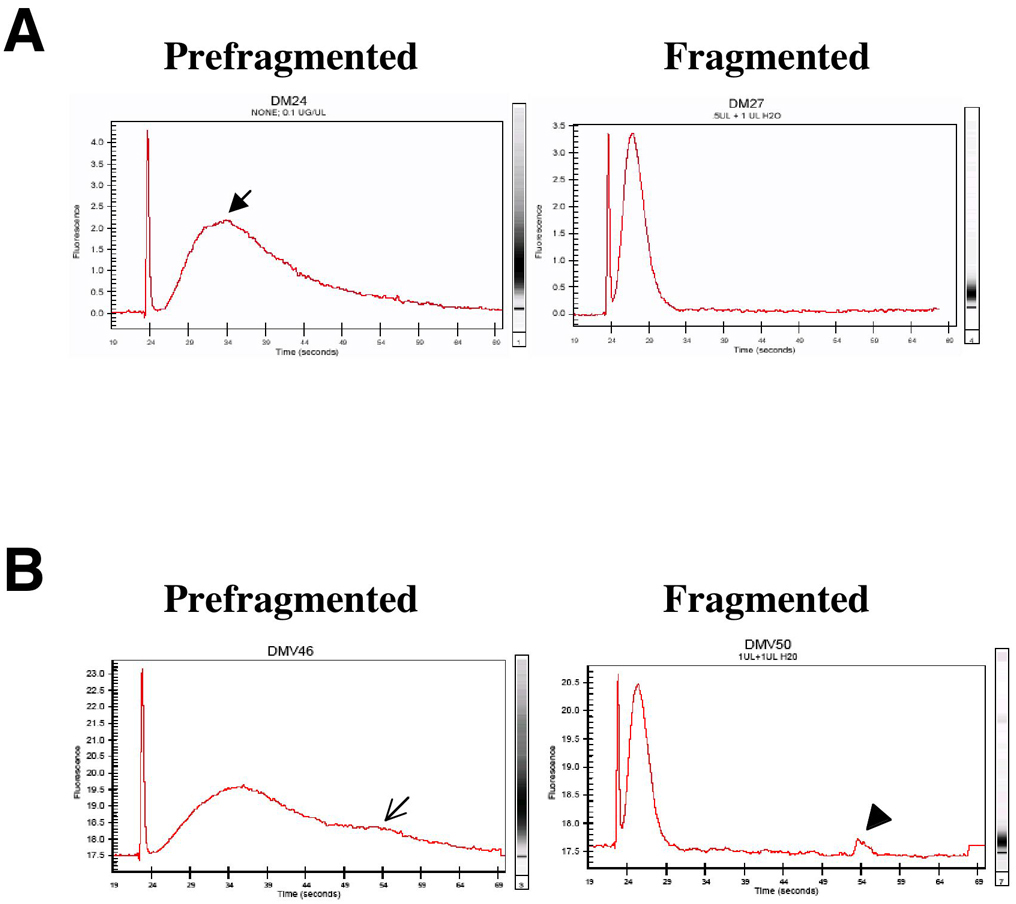
Analyze unfragmented and fragmented samples on Bioanalyzer. If samples look good (Figure 22), you may apply to a C. elegans Affy chip.
|
Figure 22. Assessing quality of RNA amplified from cultured cells for gene array hybridization. A. The prefragmented RNA should show a broad size distribution (X-axis). Smaller fragments should be more abundant (Y-axis, arrow), as the amplification process is biased to the 3' end. The gel image should be a large smear, with no intense high molecular weight products. Fragmented RNA should be 200 bp or less. B. These plots demonstrate a sample that is not hybridizable. The prefragmented RNA distribution includes a long tail indicative of non-template dependent high molecular weight products (open arrow). The presence of unfragmented peaks are evident (arrowhead). For patterns like this, we either repeat the amplification/fragmentation or discard that RNA sample (Steve Von Stetina, Rebecca Fox, and David Miller).
Alternatively, you may store amplified and fragmented RNA samples at −80°C for hybridization at a later time.
Aballay, A., and Ausubel, F. M. (2001). Programmed cell death mediated by ced-3 and ced-4 protects Caenorhabditis elegans from Salmonella typhimurium-mediated killing. Proc. Natl. Acad. Sci. USA 98, 2735–2739. Abstract Article
Brenner, S. (1974). The genetics of Caenorhabditis elegans. Genetics 77, 71–94. Abstract
Chalfie, M., Tu, Y., Euskirchen, G., Ward, W.W., and Prasher, D.C. (1994). Green fluorescent protein as a marker for gene expression. Science 263, 802–805. Abstract
Christensen, M., Estevez, A., Yin, X., Fox, R., Morrison, R., McDonnell, M., Gleason, C., Miller, D.M., 3rd, and Strange, K. (2002). A primary culture system for functional analysis of C. elegans neurons and muscle cells. Neuron 33, 503–514. Abstract Article
Collet, J., Spike, C.A., Lundquist, E.A., Shaw, J.E., and Herman, R.K. (1998). Analysis of osm-6, a gene that affects sensory cilium structure and sensory neuron function in Caenorhabditis elegans. Genetics 148, 187–200. Abstract
Costa, M., Draper, B.W., and Priess, J.R. (1997). The role of actin filaments in patterning the Caenorhabditis elegans cuticle. Dev. Biol. 184, 373–384. Abstract Article
Ellis, R.E., and Horvitz, H.R. (1991). Two C. elegans genes control the programmed deaths of specific cells in the pharynx. Development 112, 591–603. Abstract
Ellis, R.E., Jacobson, D.M., and Horvitz, H.R. (1991). Genes required for the engulfment of cell corpses during programmed cell death in Caenorhabditis elegans. Genetics 129, 79–94. Abstract
Ellis, R.E., Jacobson, D.M., and Horvitz, H.R. (1991). Genes Required for the Engulfment of Cell Corpses During Programmed Cell Death in Caenorhabditis elegans. Genetics 129, 79–94. Abstract
Fares, H., and Greenwald, I. (2001). Genetic analysis of endocytosis in Caenorhabditis elegans: coelomocyte uptake defective mutants. Genetics 159, 133–145. Abstract
Fire, A., Xu, S., Montgomery, M.K., Kostas, S.A., Driver, S.E., and Mello, C.C. (1998). Potent and specific genetic interference by double-stranded RNA in Caenorhabditis elegans. Nature 391, 806–811. Abstract Article
Fox, R.M., et al. (2005). A gene expression fingerprint of C. elegans embryonic motor neurons. BMC Genomics 6(1), p. 42.
Francis, R., Barton, M.K., Kimble, J., and Schedl, T. (1995). gld-1, a tumor suppressor gene required for oocyte development in Caenorhabditis elegans. Genetics 139, 579–606. Abstract
Gartner, A., Milstein, S., Ahmed, S., Hodgkin, J., and Hengartner, M.O. (2000). A conserved checkpoint pathway mediates DNA damage–induced apoptosis and cell cycle arrest in C. elegans. Mol. Cell 5, 435–443. Abstract Article
Gavrieli, Y., Sherman, Y., and Ben-Sasson, S.A. (1992). Identification of programmed cell death in situ via specific labeling of nuclear DNA fragmentation. J. Cell. Biol. 119, 493–501. Abstract Article
Grant, B., and Hirsh, D. (1999). Receptor-mediated endocytosis in the Caenorhabditis elegans oocyte. Mol. Biol. Cell 10, 4311–4326. Abstract
Gumienny, T.L., Lambie, E., Hartwieg, E., Horvitz, H.R., and Hengartner, M.O. (1999). Genetic control of programmed cell death in the Caenorhabditis elegans hermaphrodite germline. Development 126, 1011–1022. Abstract
Hall, D.H. (1995). Electron microscopy and three-dimensional image reconstruction. Methods Cell Biol. 48, 395–436. Abstract
Hedgecock, E.M., Culotti, J.G., Thomson, J.N., and Perkins, L.A. (1985). Axonal guidance mutants of Caenorhabditis elegans identified by filling sensory neurons with fluorescein dyes. Dev. Biol. 111, 158–170. Abstract Article
Helmchen, F., and Denk, W. (2002). New developments in multiphoton microscopy. Curr. Opin. Neurobiol. 12, 593–601. Abstract Article
Jorgensen, E.M., and Mango, S.E. (2002). The art and design of genetic screens: Caenorhabditis elegans. Nat. Rev. Genet. 3, 356–369. Abstract Article
Lettre, G., Kritikou, E.A., Jaeggi, M., Calixto, A., Fraser, A.G., Kamath, R.S., Ahringer, J., and Hengartner, M.O. (2004). Genome-wide RNAi identifies p53-dependent and -independent regulators of germ cell apoptosis in C. elegans. Cell Death Differ. Abstract Article
Michalet, X., Kapanidis, A.N., Laurence, T., Pinaud, F., Doose, S., Pflughoefft, M., and Weiss, S. (2003). The power and prospects of fluorescence microscopies and spectroscopies. Ann. Rev. Biophys. Biomol. Struct. 32, 161–182. Abstract Article
Miller, D.M., 3rd, Desai, N.S., Hardin, D.C., Piston, D.W., Patterson, G.H., Fleenor, J., Xu, S., and Fire, A. (1999). Two-color GFP expression system for C. elegans. Biotechniques 26, 914–918, 920–911. Abstract
Miyawaki, A. (2002). Green fluorescent protein-like proteins in reef Anthozoa animals. Cell Struct. Funct. 27, 343–347. Abstract Article
Nakano, A. (2002). Spinning-disk confocal microscopy – a cutting-edge tool for imaging of membrane traffic. Cell Struct. Funct. 27, 349–355. Abstract Article
Paupard, M.C., Miller, A., Grant, B., Hirsh, D., and Hall, D.H. (2001). Immuno-EM localization of GFP-tagged yolk proteins in C. elegans using microwave fixation. J. Histochem. Cytochem. 49, 949–956. Abstract
Perkins, L.A., Hedgecock, E.M., Thomson, J.N., and Culotti, J.G. (1986). Mutant sensory cilia in the nematode Caenorhabditis elegans. Dev. Biol. 117, 456–487. Abstract Article
Shaham, S., and Bargmann, C.I. (2002). Control of neuronal subtype identity by the C. elegans ARID protein CFI-1. Genes Dev. 16, 972–983. Abstract Article
Strome, S. (1986). Fluorescence visualization of the distribution of microfilaments in gonads and early embryos of the nematode Caenorhabditis elegans. J. Cell. Biol. 103, 2241–2252. Abstract Article
Sulston, J.E., and Horvitz, H.R. (1977). Post-embryonic cell lineages of the nematode, Caenorhabditis elegans. Dev. Biol. 56, 110–156. Abstract Article
Sulston, J.E., Schierenberg, E., White, J.G., and Thomson, J.N. (1983). The embryonic cell lineage of the nematode Caenorhabditis elegans. Dev. Biol. 100, 64–119. Abstract Article
Sulston, J.E., Schierenberg, E., White, J.G., and Thomson, J.N. (1983). The Embryonic Cell Lineage of the Nematode Caenorhabditis elegans. Dev. Biol. 100, 64–119. Abstract Article
Thellmann, M., Hatzold, J., and Conradt, B. (2003). The Snail-like CES-1 protein of C. elegans can block the expression of the BH3-only cell-death activator gene egl-1 by antagonizing the function of bHLH proteins. Development 130, 4057–4071. Abstract Article
Timmons, L., and Fire, A. (1998). Specific interference by ingested dsRNA. Nature 395, 854. Abstract Article
Wallace, W., Schaefer, L.H., and Swedlow, J.R. (2001). A workingperson's guide to deconvolution in light microscopy. Biotechniques 31, 1076–1078, 1080, 1082 passim. Abstract
Wu, Y.C., Stanfield, G.M., and Horvitz, H.R. (2000). NUC-1, a Caenorhabditis elegans DNase II homolog, functions in an intermediate step of DNA degradation during apoptosis. Genes Dev. 14, 536–548. Abstract
Yang, T.T., Kain, S.R., Kitts, P., Kondepudi, A., Yang, M.M., and Youvan, D.C. (1996). Dual color microscopic imagery of cells expressing the green fluorescent protein and a red-shifted variant. Gene 173, 19–23. Abstract Article
Zhang, J., Campbell, R.E., Ting, A.Y., and Tsien, R.Y. (2002). Creating new fluorescent probes for cell biology. Nat. Rev. Mol. Cell. Biol. 3, 906–918. Abstract Article
Zhang, S., Ma, C., and Chalfie, M. (2004). Combinatorial marking of cells and organelles with reconstituted fluorescent proteins. Cell 119, 137–144. Abstract Article
*Edited by Victor Ambros. Last revised August 12, 2005. Published January 02, 2006. This chapter should be cited as: Shaham, S., ed., WormBook: Methods in Cell Biology (January 02, 2006), WormBook, ed. The C. elegans Research Community, WormBook, doi/10.1895/wormbook.1.49.1, http://www.wormbook.org.
Copyright: © 2006 Shai Shaham and contributors. This is an open-access article distributed under the terms of the Creative Commons Attribution License, which permits unrestricted use, distribution, and reproduction in any medium, provided the original author and source are credited.
§To whom correspondence should be addressed. E-mail: shaham@rockefeller.edu
 All WormBook content, except where otherwise noted, is licensed under a Creative Commons Attribution License.